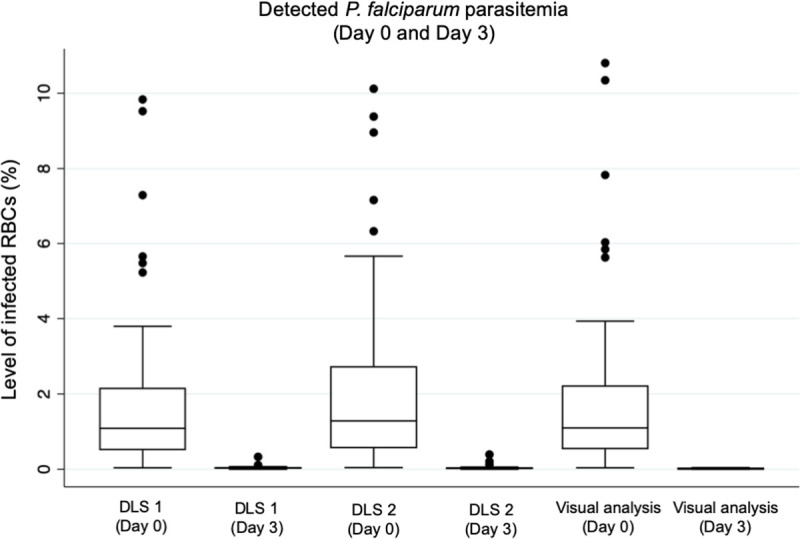
Fig 7. Detected levels of parasitemia on Day 0 and Day 3, following initiation of treatment.

Box plots illustrating the detected levels of P. falciparum parasitemia (percentage of infected red blood cells; RBCs) in blood smears collected at baseline, prior to initiation of treatment (Day 0) and three days following initiation of treatment (Day 3). Results shown as detected by analysis with the deep learning systems (DLS) and by visual analysis of the digital slides.
