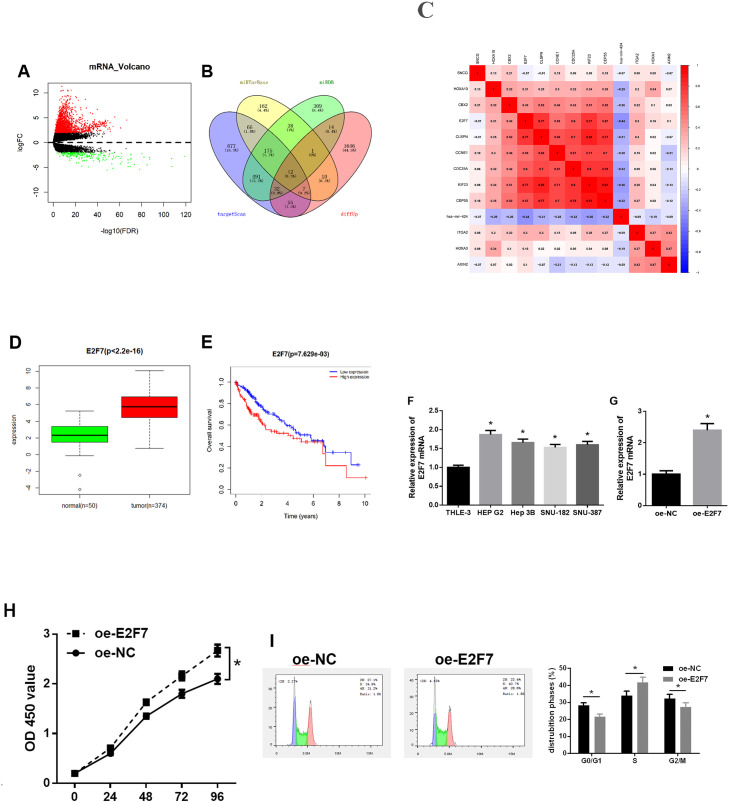
Fig 2. Expression level and function of E2F7 in HCC.
A: Volcano plot of DEmRNAs in normal group and tumor group of HCC in the TCGA-LIHC dataset; B: Venn diagram of predicted target genes of miR-424-5p and upregulated DEmRNAs in TCGA; C: Pearson correlation analysis of miR-424-5p and its predicted candidate target genes; D: Box plot of the expression of E2F7 in normal group and tumor group; E: The survival curves were plotted to show the effect of E2F7 expression level on the prognosis of patients (red line represents high expression group, and blue line represents low expression group); F: The mRNA expression level of E2F7 in normal cell line THLE-3 and four HCC cell lines (HEP G2, Hep 3B, SNU-182 and SNU-387) was measured by qRT-PCR; G: The transfection efficiency of oe-E2F7 was measured by qRT-PCR; H: The proliferative activity of HEP G2 cells transfected with oe-E2F7 was detected by CCK-8 assay; I: The cell cycle distribution was analyzed by flow cytometry; * p<0.05.

