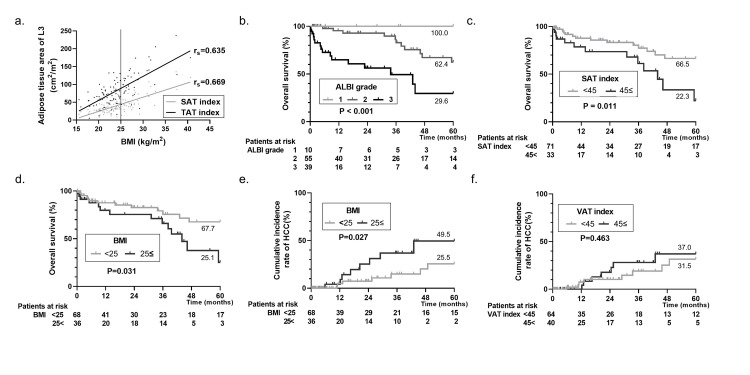
Fig 1. Kaplan–Meier curve and cumulative incidence plot based on the univariate Cox regression analysis.
BMI was correlated with the adipose tissue area (a): SAT index (rs = 0.669) and TAT index (rs = 0.635). 45 cm2/m2 of SAT index and 90 cm2/m2 of TAT index were equivalent to 25 kg/cm2 of BMI. The Kaplan–Meier curve indicated significantly poor prognosis in an advanced grade of liver function on ALBI grade (P < 0.001, 5-year survival rates were 100.0 vs 62.4 vs 29.6, b) and the accumulation of SAT (P = 0.011, HR 3.931, 95% CI 1.286–7.142, the cutoff value of SAT index was 45 cm2/m2, 5-year survival rates were 66.5 vs 22.3, c). Furthermore, obesity was also revealed as a significantly poor prognosis (P = 0.031, HR 2.440, 95% CI 1.084–5.490, the cutoff value of BMI was 25 kg/cm2, 5-year survival rates were 67.7 vs 25.1, d) but not more marked than SAT. The cumulative incidence rate indicated significantly higher HCC complication in obesity (P = 0.027, HR 3.652, 95% CI 1.158–11.52, the cutoff value of BMI was 25 kg/cm2, 5-year incidence rate were 25.5 vs 49.5, e), but no differences in the accumulation of VAT (P = 0.463, HR 1.482, 95% CI 0.518–4.243, the cutoff value of VAT index was 45 cm2/m2, 5-year incidence rate were 31.5 vs 37.0, f). L3, third lumbar vertebra; BMI, body mass index; SAT, subcutaneous adipose tissue; TAT, total adipose tissue; ALBI, albumin–bilirubin; HCC, hepatocellular carcinoma; VAT, visceral adipose tissue; CI, confidence interval.

