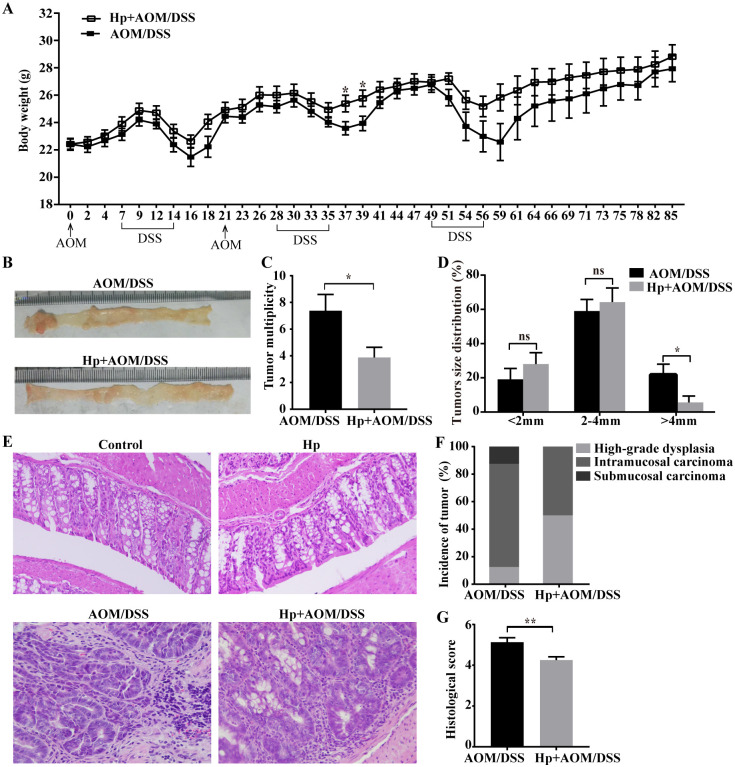
Fig 2. H. pylori infection attenuated the development of CAC.
CAC was induced in mice of AOM/DSS-treated group (AOM/DSS) and AOM/DSS-treated with H. pylori infection group (Hp+AOM/DSS). (A) Body weight change (n = 8/group). (B) Representative images of colon tumors. (C) Tumor multiplicity (n = 8/group). (D) Tumor size distribution (n = 8/group). (E) Representative images of colonic tissues in control and H. pylori infection (Hp) group and tumor tissues in AOM/DSS group and Hp+AOM/DSS group by H&E staining (×200). (F) The incidence of each tumor grading (n = 8/group). (G) Histological inflammation scores (n = 8/group). Data are represented as mean ± SEM. *P < 0.05, **P < 0.01, ns, not significant.

