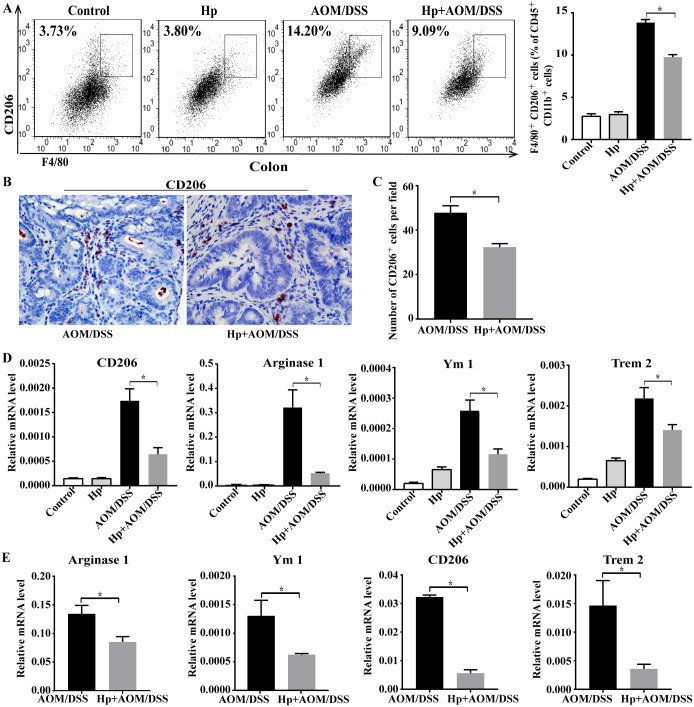
Fig 4. H. pylori infection reduced M2 macrophages proportion in CAC.
(A) Flow cytometry analysis of CD45+CD11b+F4/80+CD206+ M2 macrophages in colonic tissues from AOM/DSS-treated group (AOM/DSS) and AOM/DSS-treated with H. pylori infection group (Hp+AOM/DSS) (n = 6/group). (B) Representative immunohistochemical images of the M2 marker CD206 staining in tumor tissues (×400) and (C) the numbers of CD206+ cells per field (n = 6/group). (D) Relative mRNA expression of M2-associated genes (Arginase1, CD206, Trem2 and Ym1) in colonic tumors (n = 5-6/group). (E) Arginase1, Ym1, CD206 and Trem2 mRNA expression in F4/80+ macrophages isolated from tumors of AOM/DSS group and Hp+AOM/DSS group (n = 5-6/group). Data are represented as mean ± SEM. *P < 0.05.

