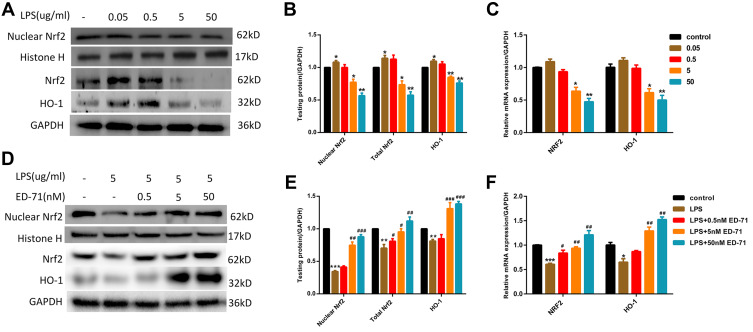
Figure 4.
ED-71 activated Nrf2/HO-1 suppressed by LPS. (A and B) The protein content and (C) Relative mRNA expression in HGFs treated only by various concentration LPS. (D and E) The protein content and (F) Relative mRNA expression in HGFs treated with various concentration ED-71 for 24 h or 5 μg/mL LPS for 6 h. Values were exhibited as mean ± SEM from three experiments independently. ***P < 0.001, **P < 0.01 and *P < 0.05 compared with control group. ###P < 0.001, ##P < 0.01 and #P < 0.05 compared with the group only treated by 5 μg/mL LPS.

