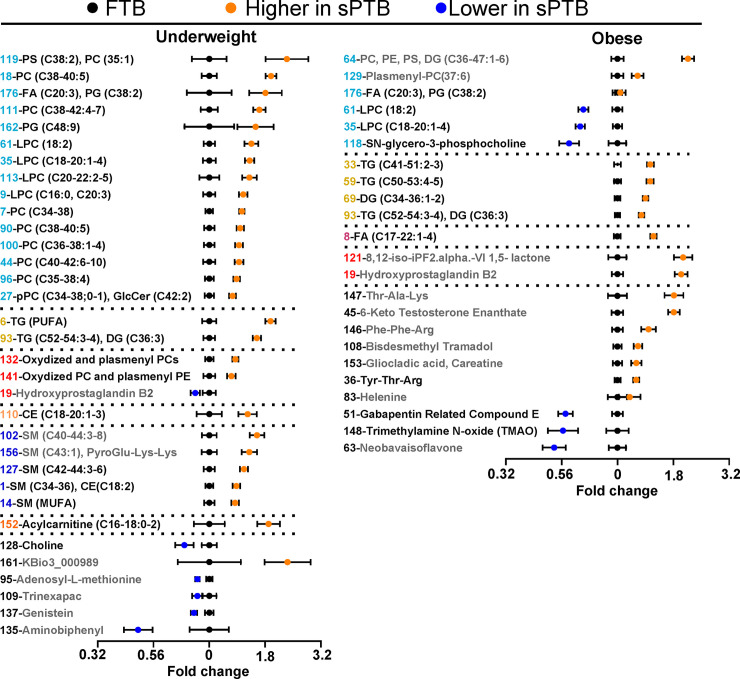
Fig 3. Differences in complex lipids and biogenic amines between sPTB and FTB deliveries.
Results of the t-test analysis performed on variable cluster components, presented for women with underweight and obese BMI. Data are presented as the fold change from the FTB for each weight category. Each cluster is represented by a number and labeled with either a general description of variables within the cluster or the most representative metabolite. Clusters composed uniquely from metabolites identified only by parent mass (i.e. MSI level 3) are colored gray and should be interpreted with caution. A complete list of metabolites within each cluster with group means, p-values and MSI level are provided in the S3 Table. All displayed variables have p < 0.05 and passed FDR correction at q = 0.2. PC–phosphatidylcholine; PE–phosphatidylethanolamine; PS–phosphatidylserine; TG–triglyceride: DG–diglyceride; CE–cholesterol ester; SM–sphingomyelin; CA–cholic acid; FA–Fatty acids. Clusters are colored according their lipid classes: phospholipids and lysophospholipids–light blue; TG–yellow; oxidized lipids–red; SM–blue; CE–light orange; FA–purple; acylcarnitine–dark orange. Description of complex lipids—(total number of fatty acids carbon atoms: total number of double bounds). Error bars represent standard error. N = 17 per group.

