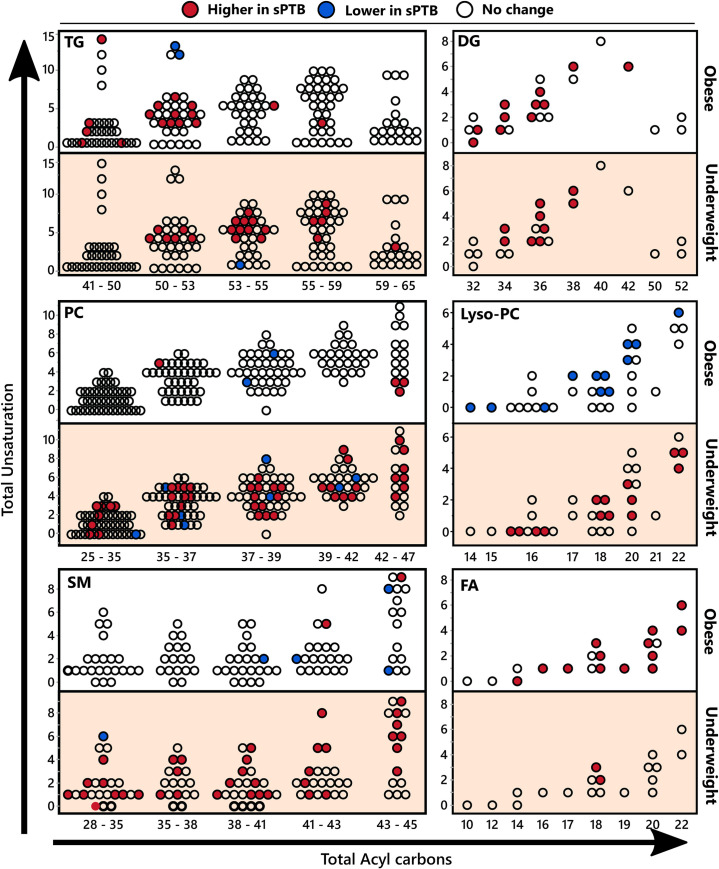
Fig 4. Serum complex lipids stratified by acyl chain length and number of double bonds.
Differences in serum complex lipids between birth categories in obese and underweight women, stratified by acyl chain length and number of double bonds. Dots represent complex lipid species, and are positioned according to the total acyl chain unsaturation (y axis) and the total acyl chain length (x axis). Colors indicate significance and directionality of compared means (t-test p <0.05): red–higher in sPTB, blue–lower in sPTB, white–no change. TG–triglyceride; DG–diglyceride PS–phosphatidylserine; SM–sphingomyelin; FA–fatty acids. The number of detected individual complex lipids and the number of differences between sPTB and FTB for each chemical class are summarized in S5 Table. Means of individual lipids and corresponding p-values are provided in S3 Table.

