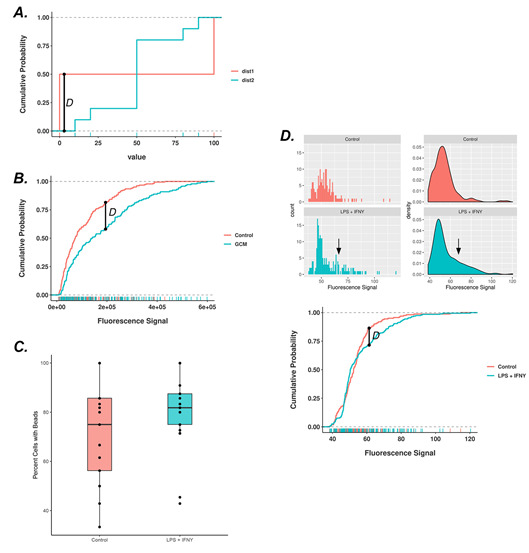
Figure 2. Comparison of quantification of phagocytosis using traditional metrics vs the proposed new method of analysis.

A. Empirical cumulative distribution functions (ECDFs) of non-parametric, multimodal hypothetical datasets dist1 and dist2. The ECDF more accurately portrays the changes that occur in the underlying PDF. B. ECDFs of data experimentally derived from Figure 1A, Experiment 1. The D statistic is plotted, showing the maximal distance between the curves. C. Using traditional metrics to quantify phagocytosis in vitro, cells that were positive for bead engulfment were divided by the total number of cells per field of view. Data are derived from Experiment 2. D. Top panel: Using the new methodology histogram and density curves of data derived from Experiment 2. A right-shift in the PDF is denoted by an arrow. Bottom panel: ECDFs of data derived from Experiment 2. The D statistic is plotted, showing the maximal distance between the curves.
