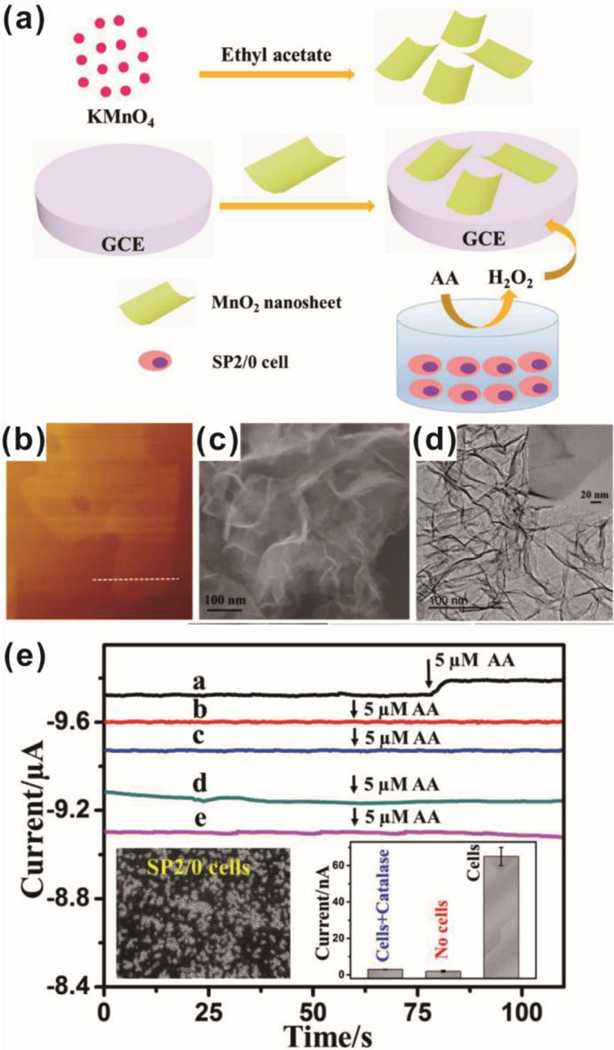
Figure. 5.
Non-destructive, live-cell monitoring technique by H2O2 monitoring using MnO2 nanosheets on a glass carbon electrode (GCE). (a) Schematic illustration of H2O2 detection from SP2/0 cells. (b-d) Characterization of MnO2 nanosheets. (e) Amperometric i-t curves of the response of GCE with MnO2 nanosheets (curve a) and without MnO2 nanosheets (curve d) for the reduction of H2O2 released from SP2/0 cells. Amperometric i-t curves of the response of GCE with MnO2 nanosheets (curve b) and without MnO2 nanosheets (curve e) in the absence of SP2/0 cells. Amperometric i-t curves of the response of GCE with MnO2 nanosheets (curve c) in the presence of SP2/0 cells and catalase. Reprinted with permission from ref. 91.

