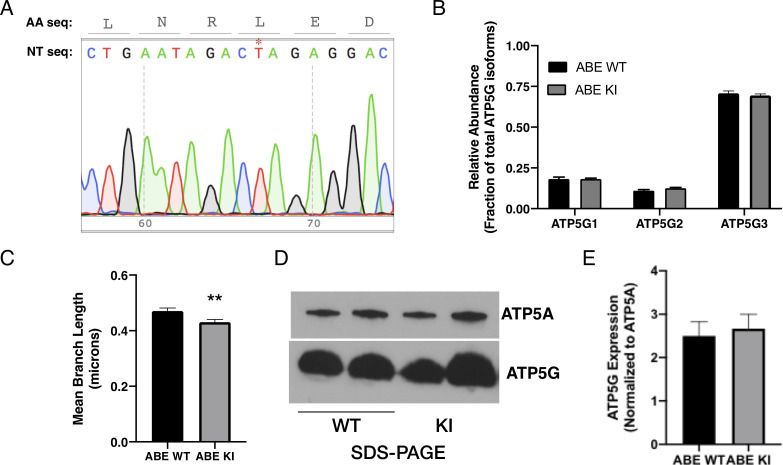
Figure 4. CRISPR base editing to generate ATP5G1L32P AGS NPCs results in a partial loss of AGS metabolic resilient phenotypes.
(A) AGS ATP5G1 CRISPR base editing strategy. To create AGS cells with the human amino acid substitution at leucine-32, AGS cells transiently expressing ABEmax were nucleofected with an sgRNA (blue underline) directed toward a PAM site (green underline) on the (-) strand to target conversion of adenine to guanine, which on the (+) strand is a cytosine-to-thymine (*). (B) Sequencing data from a successfully edited clonal AGS cell line demonstrating the cytosine-to- thymine base edit resulting in the desired leucine to proline knock-in cell line. (C) AGS ATP5G1L32P (ABE KI) NPCs exhibit decreased cell survival compared to unedited AGS cells (ABE WT) when exposed to hypoxia (1%, 24 hr), hypothermia (31°C, 72 hr), or rotenone (10 μM, 16 hr). Bar graphs represent the mean ± SEM of three independent experiments with three replicates/condition. (D) Seahorse XF analyzer assay of cultured ABE KI and WT cells sequentially exposed to (i) oligomycin (1 μM), (ii) FCCP (2 μM), and (iii) rotenone/antimycin (0.5 μM) showing enhanced FCCP-stimulated oxygen consumption (spare respiratory capacity). Data represents the mean ± SEM of 3 independent experiments with 4–6 replicates/species. (E and F) Representative confocal images of ABE WT (E) and ABE KI (F) NPCs expressing the mitochondrial marker mCherry-mito7 to demonstrate mitochondrial morphology one hour following treatment with FCCP. Scale bar represents 5 μm. (G) Percent of mitochondria ± SEM with fragmented morphology, data obtained from 50 to 60 cells/genotype. (H) Relative fluorescence ± SEM of 3 independent experiments in triplicate each of cultured ABE AGS NPCs loaded with TMRE (50 nM) and exposed to vehicle or FCCP (1 μM). (I) Complex V enzymatic activity normalized to protein content of ABE WT and KI mitochondrial extracts normalized to protein content and treated with vehicle or oligomycin (1 μM). Data are the mean ± SEM of 3 independent experiments expressed as a fraction of ABE WT enzymatic activity. (J) Representative immunoblots for ATP5G (left), ATP5A (right), or citrate synthase (CS, left, input control) of clear-native gel electrophoresis of mitochondrial extracts from ABE WT and ABE demonstrate ATP synthase dimers (D) and monomers (M). (K) Quantification of ATP5G demonstrates a reduction in ATP synthase dimers relative to total ATP synthase protein (D:(D+M) ratio) in ABE KI. Data are mean ± SEM of 3 independent blots. *p<0.05; **p<0.01.


