. 2020 Nov 9;9:e62039. doi: 10.7554/eLife.62039

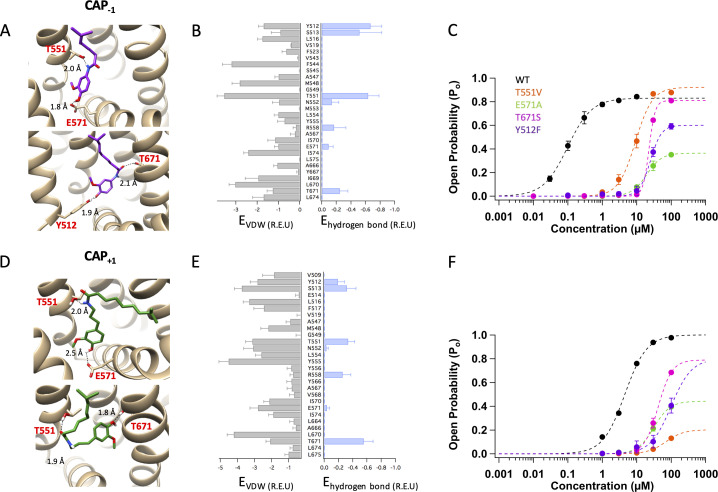
Figure 3. Docking of Cap-1 (A–C) and Cap+1 (D–F) reveals interacting channel residues and binding poses of agonists.

(A) Representative binding poses of CAP-1 inside the ligand-binding pocket. (B) Energy of predicted VDW and hydrogen bond for each ligand-binding pocket residues. (C) Concentration-response curves of WT and mutant channels in the presence of CAP-1. (D) Representative binding poses of CAP+1. (E) Energy of predicted VDW and hydrogen bond for each ligand-binding pocket residues. (F) Concentration-response curves of WT and mutant channels in the presence of CAP+1. Units of energy are R.E.U. (Rosetta Energy Unit). n = 3–5 cells.

Figure 3.

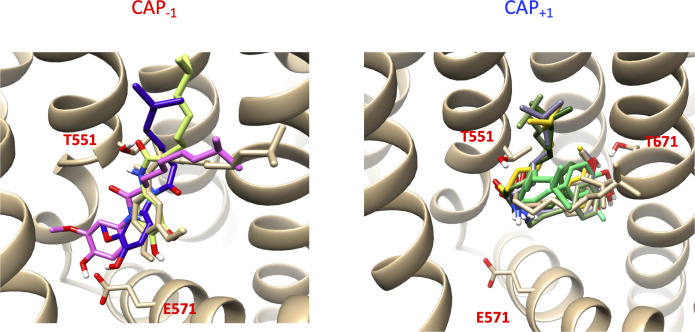
Figure 3—figure supplement 1. Representatives of the vertical binding poses for Cap-1 (left) and the horizontal binding poses for Cap+1 (right) among the 30 top models.

Figure 3—figure supplement 1.

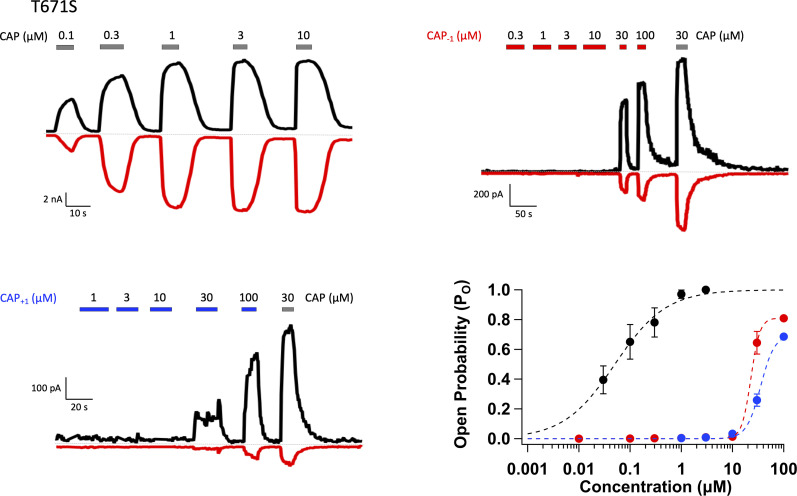
Figure 3—figure supplement 2. Representative whole-cell patch-clamp recordings of TRPV1 T671S mutant activated by capsaicin (top left), Cap-1 (top right), and Cap+1 (bottom left), and the concentration-response curves (bottom right).

Figure 3—figure supplement 2.

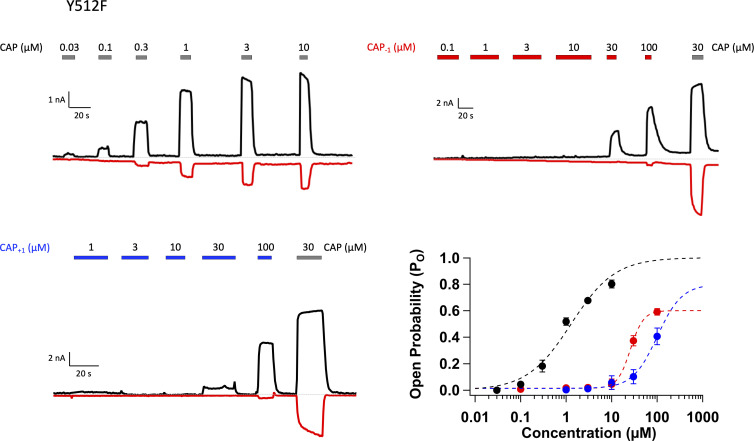
Figure 3—figure supplement 3. Representative whole-cell patch-clamp recordings of TRPV1 Y512F mutant activated by capsaicin (top left) and Cap-1 (top right), and the concentration-response curves (bottom).

Figure 3—figure supplement 3.