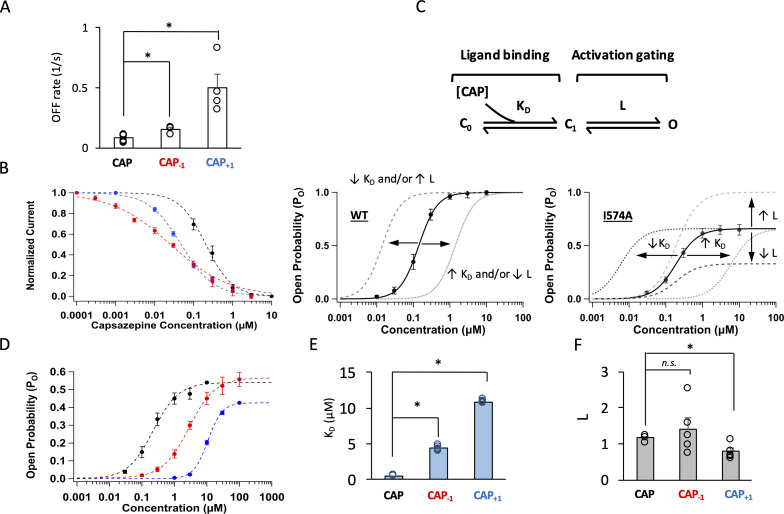
Figure 4. Modifying the neck of capsaicin lowers the binding affinity and allosteric constant for gating.
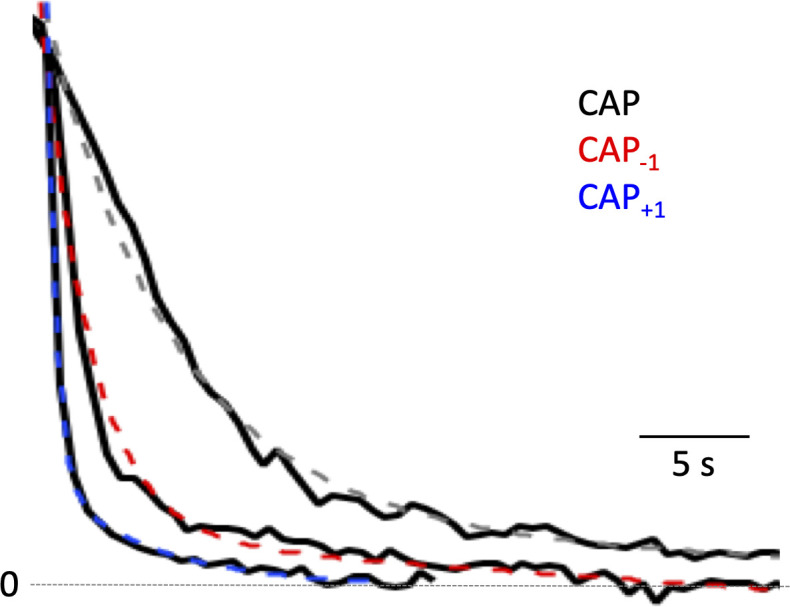
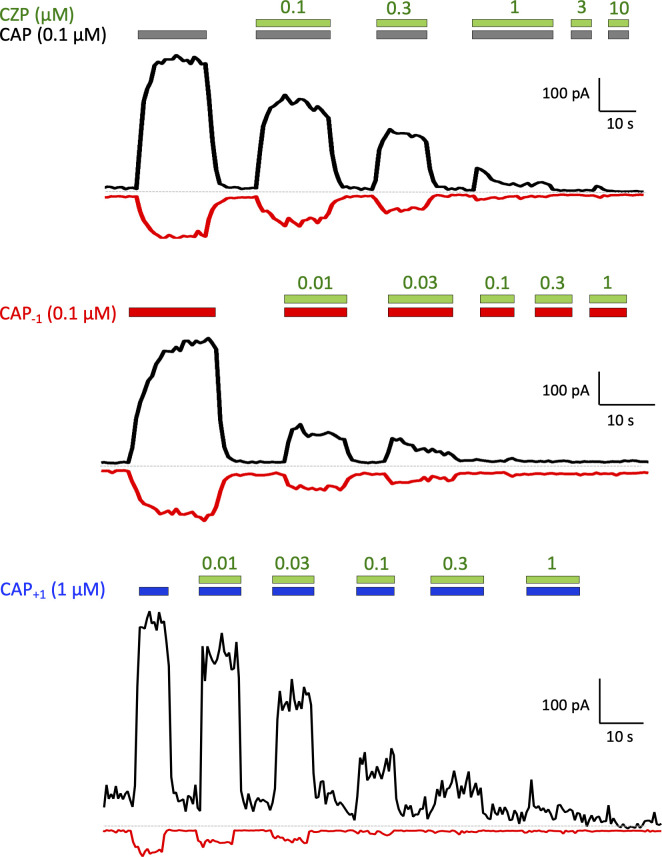
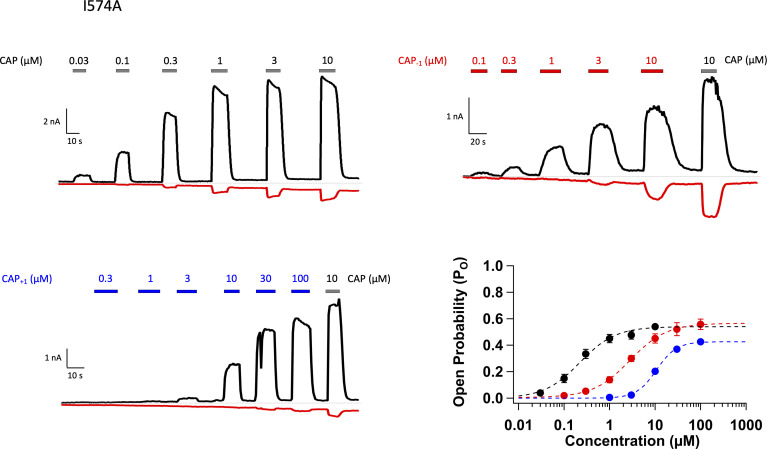
(A) Comparison of the OFF rates. (B) Concentration-response curves of capsazepine inhibition, with a Hill function fit superimposed. n = 3–5 cells. (C) Gating scheme of capsaicin ligand binding to TRPV1 and activation gating, with corresponding equilibrium constant K and L, respectively. Graphical representation of the challenge for interpretation of changes in EC50 of the WT channels when Po is high (bottom left). The I574A mutation reduces the maximal Po, allowing for the differentiation between changes in K and L. (D) Concentration-response curves of TRPV1 I574A in the presence of capsaicin or its analogs. n = 4–6 cells. (E) Comparison of K and (F) L values for capsaicin and its analogs.
Figure 4—figure supplement 1. Capsaicin analogs exhibited a more rapid off rate.


