. 2020 Nov 9;9:e62039. doi: 10.7554/eLife.62039

Figure 5. Capsaicin analogs elicit a structurally similar permissive state of the TRPV1 ligand-binding pocket.

(A and B) Comparisons of the ligand-binding pocket permissive conformations induced by CAP-1 (A) or CAP+1 (B) to the cryo-EM structure of capsaicin-bound state (3J5R). The backbone RMSD of the top 30 models are presented. (C) Eyring energy profiles of capsaicin and its analogs. The concentration of each ligand was taken as 10 µM. (D) Cartoon summary of TRPV1 activation by capsaicin and its analogs. Blue represents electropositive areas and red represents electronegative areas.

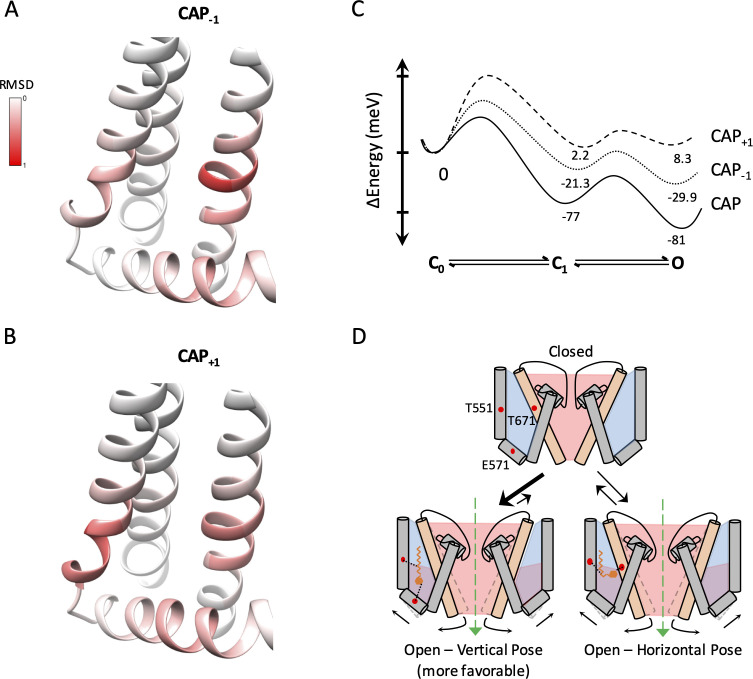
Figure 5.

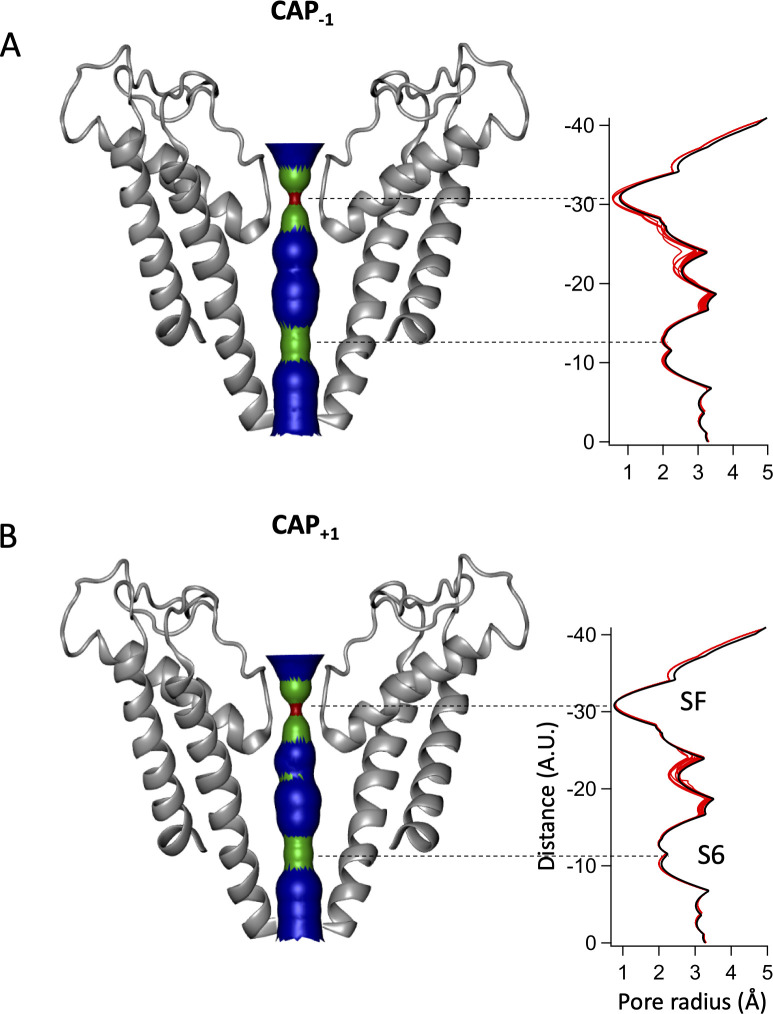
Figure 5—figure supplement 1. Pore radii of Cap-1 (A) and Cap+1 (B) models (left) with its distribution plot (right).

Figure 5—figure supplement 1.

Red lines represent the top 30 models from docking simulations from each analog. Black line represents the pore radii distribution of 3J5R. SF, selectivity filter. A.U., arbitrary units.
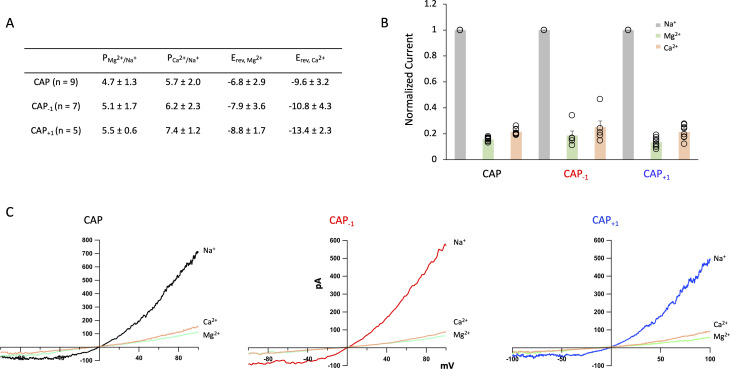
Figure 5—figure supplement 2. TRPV1 currents induced by Cap and its analogs exhibit similar ion permeation properties.

Figure 5—figure supplement 2.

(A) Summary table of Cap and its analogs. Px/Na+ - permeability ratio of cation x relative to 140 mM Na+. Erev – reversal potential. Permeability ratios were calculated using the Goldman-Hodgkin-Katz equation. (B) Normalized current from inside-out patches measured at +80 mV with 140 mM Na+ in the pipette and test cations (Mg2+ or Ca2+) in the bath. (C) Representative IV curves for Cap, Cap-1, and Cap+1 with same conditions as (B) using a ramp protocol from −100 mV to +100 mV.
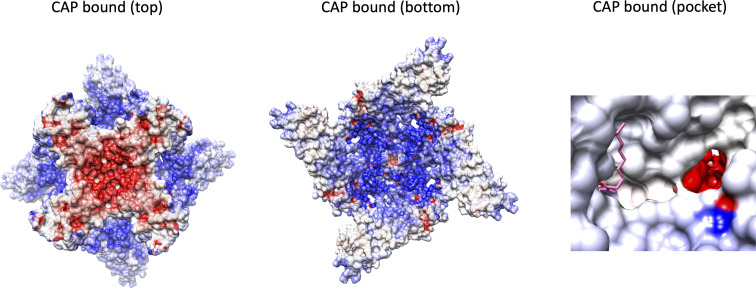
Figure 5—figure supplement 3. Electrostatic potential distribution of TRPV1 in the capsaicin-bound state, with top and bottom views.

Figure 5—figure supplement 3.

The ion permeation pathway can also be viewed from a side view of the vanilloid-binding pocket with a capsaicin molecule in pink. Blue represents more electropositive regions with red representing electronegative regions.
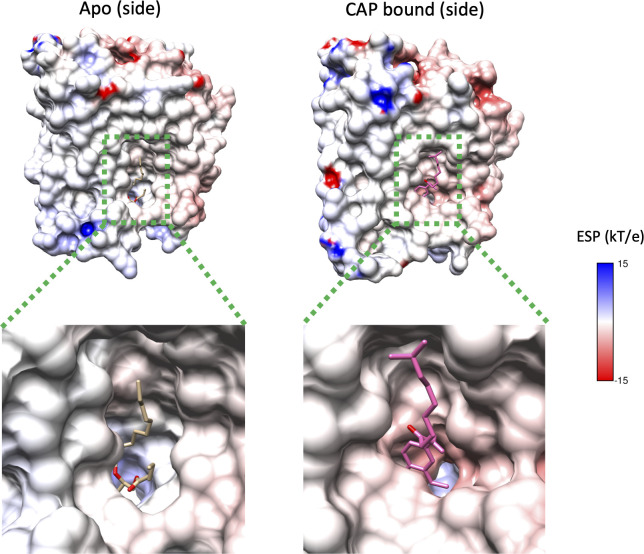
Figure 5—figure supplement 4. Electrostatic potential of TRPV1 ligand-binding pocket.

Figure 5—figure supplement 4.

Side view of the electrostatic potential of TRPV1 (PDB: 5IRZ) with a lipid bound (top left) and a zoomed in view of the ligand-binding pocket (bottom left). Side view of the electrostatic potential of TRPV1 in the capsaicin bound state (top right; PDB: 3J5R) and a zoomed in view of the ligand-binding pocket (bottom right). Scale bar represents the electrostatic potential with blue being positive and red being negative.
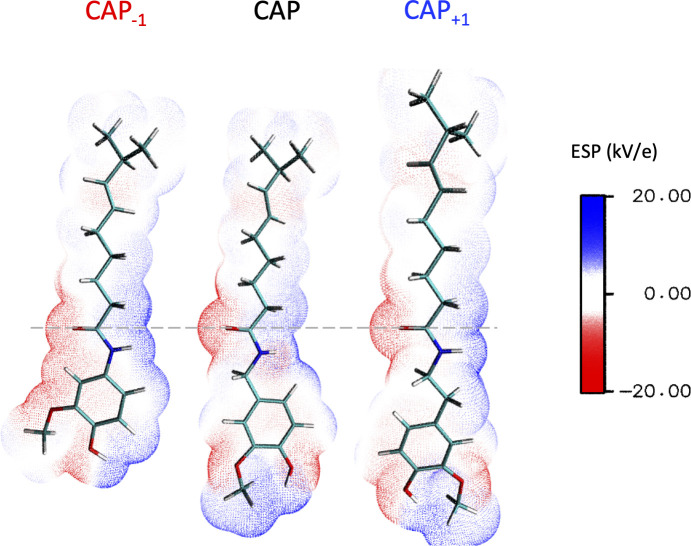
Figure 5—figure supplement 5. Electrostatic potential of capsaicin and its analogs.

Figure 5—figure supplement 5.

Dashed line marks the position of the carbonyl oxygen on the neck of the compounds. Scale bar represents the electrostatic potentials with blue being electropositive and red being electronegative.
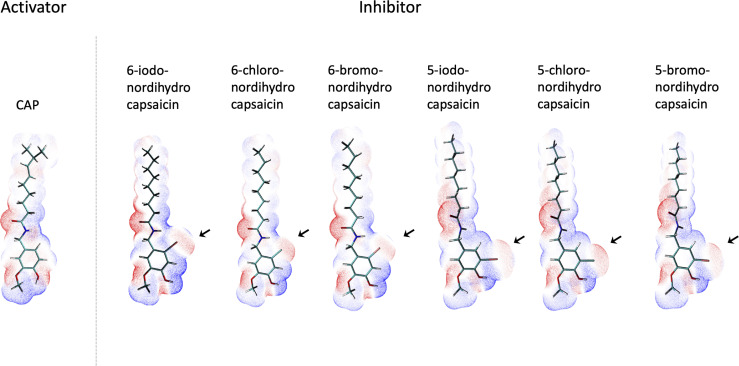
Figure 5—figure supplement 6. Electrostatic potential maps of capsaicin and halogenated capsaicin analogs.

Figure 5—figure supplement 6.

Electrostatic potential maps of capsaicin and halogenated capsaicin analogs (Br, Cl, I – at either five or six position) were generated using MultiWFN. Red represents more electronegative regions and blue represents more electropositive.