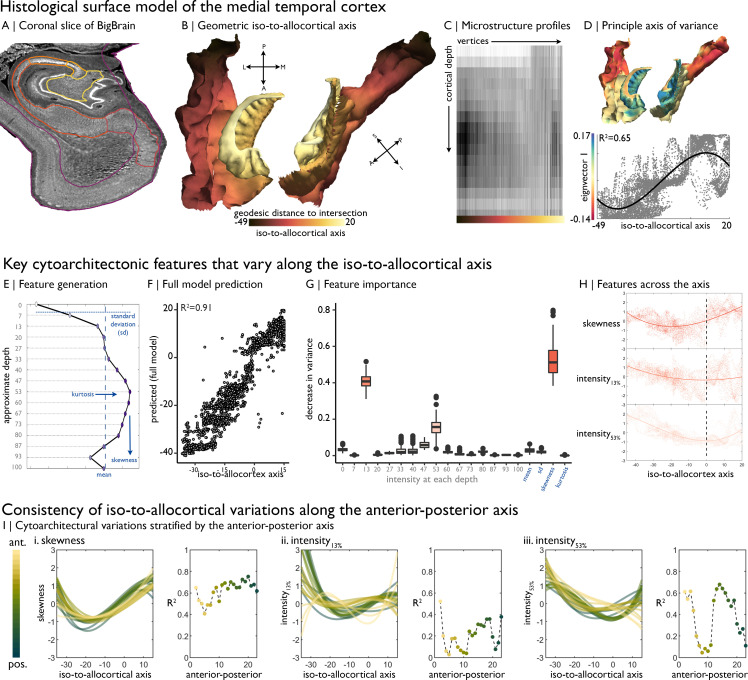
Figure 1. Cytoarchitectural profiling of the mesiotemporal confluence.
(A) Isocortical and allocortical surfaces projected onto the 40 µm BigBrain volume. Notably, conventional isocortical surface construction skips over the allocortex. Purple = isocortex. Red = subiculum. Dark orange = CA1. Orange = CA2. Light orange = CA3. Yellow = CA4. (B) The iso-to-allocortical axis was estimated as the minimum geodesic distance to the intersection of the isocortical and hippocampal surface models. (C) Intensity sampling along 16 surfaces from the inner/pial to the outer/white surfaces produced microstructure profiles. Darker tones represent higher cellular density/soma size. (D) Above. The principle eigenvector/axis of cytoarchitectural differentiation, projected onto the confluent surface. Below. The association between the principle eigenvector and the iso-to-allocortical axis, with the optimal polynomial line of best fit. (E) Cytoarchitectural features generated for each microstructure profile. (F) Empirical vs predicted position on the iso-to-allocortical, based on supervised random forest regression with cross-validation. (G) Feature importance was approximated as how much the feature decreased variance in the random forest. (H) Cubic fit of each selected feature with the iso-to-allocortical axis. Feature values are z-standardised. (I) Line plots show the cubic fit of cytoarchitectural features to the iso-to-allocortical axis within 23 bins of the anterior-posterior axis (yellow-to-green). Neighbouring scatter plots depict the goodness of fit (adjusted R2) of each polynomial, showing high consistency of the pattern of skewness.


