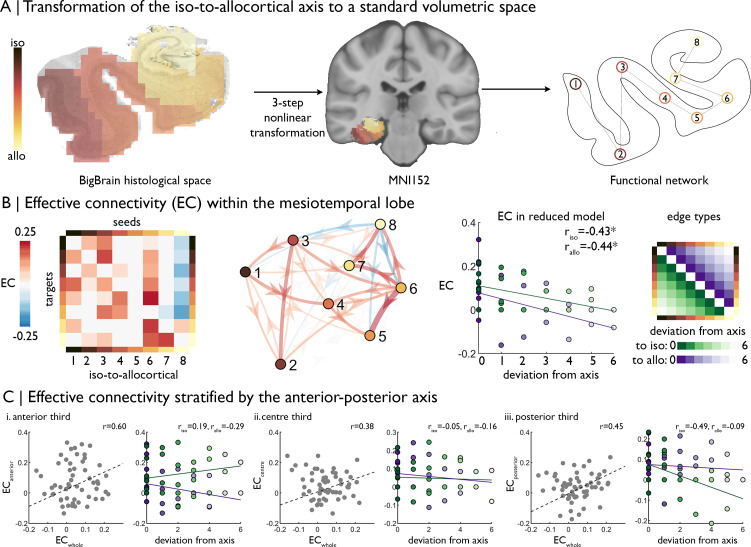
Figure 2. | Intrinsic functional signal flow across the cortical confluence.
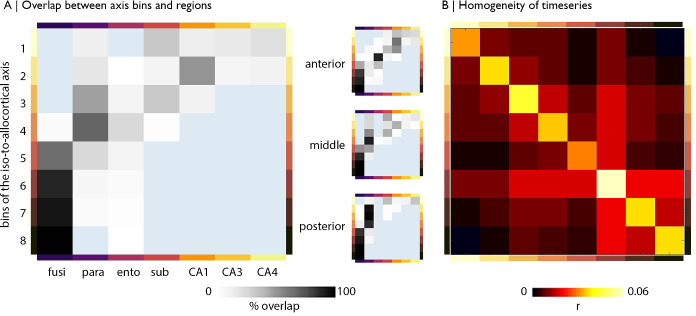
(A) The surface-based iso-to-allocortical axis was projected into the native volume space of BigBrain, then registered to stereotaxic MNI152 space. We used this as a standard atlas to extract resting state functional MRI timeseries. An 8-node decomposition was used for the dynamic model (subregion overlap shown in Figure 2—figure supplement 1 ). (B) Left Posterior estimates of effective connectivity (EC) between 8-nodes of the iso-to-allocortical axis. Columns are seeds and rows are targets. Right. Strength of effective connectivity with deviation from the iso-to-allocortical axis, stratified by direction. * signifies pFDR <0.05. (C) Association of effective connectivity within anterior-posterior thirds of cortical confluence model (y-axes) with effective connectivity of the whole model and deviation from the iso-to-allocortical axis (x-axes).


