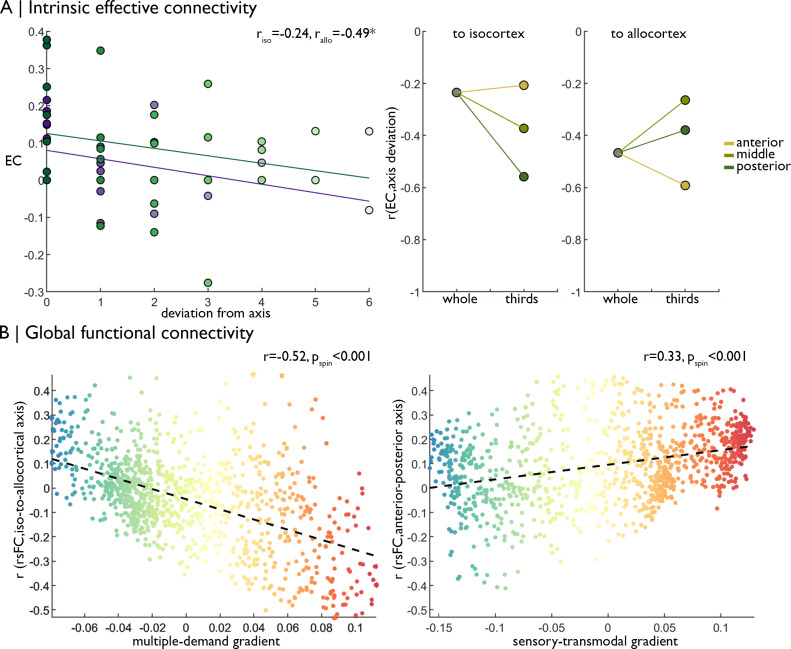
Figure 4. Replication of functional analyses in an independent dataset.
(A) Left Strength of effective connectivity decreases with deviation from the iso-to-allocortical axis. Green = to isocortex. Purple = to allocortex. Right The correlation between effective connectivity and deviation from iso-to-allocortical axis differed within anterior, middle and posterior thirds. (B) Scatterplots show relationship between varying strength of rs-fMRI along the iso-to-allocortical (left) and anterior-posterior (right) axes mirror multiple-demand and sensory-transmodal isocortical functional gradients, respectively.

