. 2020 Oct 27;9:e58533. doi: 10.7554/eLife.58533

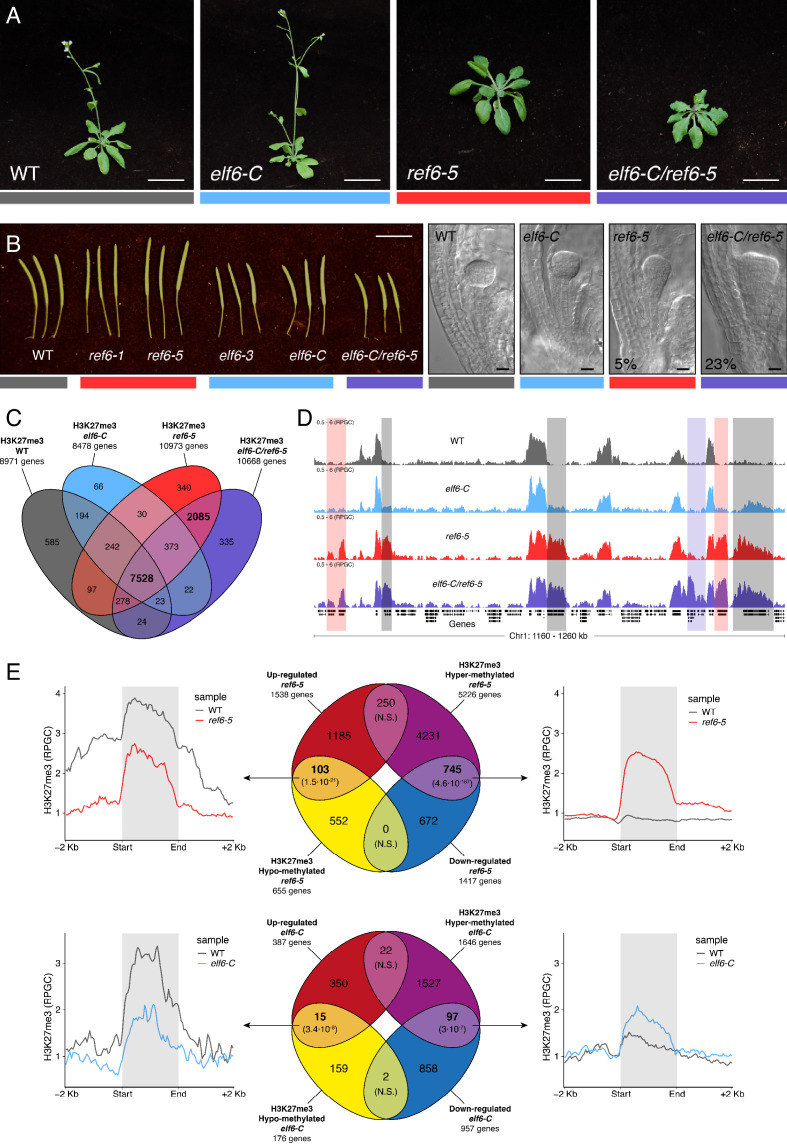
Figure 1. Arabidopsis Histone demethylases ELF6 and REF6 play distinct roles in development and H3K27me3 homeostasis.

(A) Arabidopsis wild-type (WT) and histone demethylase mutants (elf6-C, ref6-5 and elf6-C/ref6-5). Scale bars, 1 cm. (B) Siliques and embryos from Arabidopsis wild-type (WT) and different mutant alleles of histone demethylase ELF6 and REF6. Numbers show the frequency of the abnormal embryos (n = 250). Scale bars 1 cm and 10 μm, respectively. (C) Venn diagram showing the overlap between genes accumulating H3K27me3 in wild-type (WT) and histone demethylase mutants (elf6-C, ref6-5 and elf6-C/ref6-5). (D) Genome browser views of background subtracted ChIP-seq signals as normalized reads per genomic content (RPGC). Shaded red boxes, genes targeted exclusively by REF6. Shaded grey boxes, genes targeted by REF6 and ELF6. Shaded purple boxes, genes targeted by both REF6 and ELF6, and only hyper-methylated in double mutant elf6-C/ref6-5. (E) Venn diagram showing overlap between differentially expressed genes (DEGs) and H3K27me3 differentially methylated genes in histone demethylase mutants. To the left metaplot for H3K27me3 levels for genes both up-regulated and hypo-methylated and to the right metaplot of H3K27me3 levels in genes both down-regulated and hyper-methylated. Top panel, ref6-5; Bottom panel, elf6-C. p-values for Fisher’s exact test are shown in brackets, N.S. Not Significant. 

Figure 1.

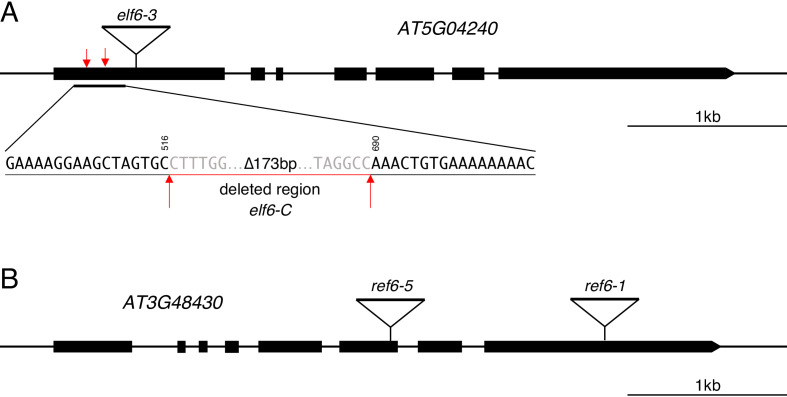
Figure 1—figure supplement 1. Graphical representation of mutant alleles for ELF6 and REF6 used in this study.

Figure 1—figure supplement 1.

(A) Schematic diagram of ELF6 locus showing the location of different mutant alleles: elf6-3 is a T-DNA insertion (SALK_074694) in the first exon and elf6-C is a CRISPR/Cas9 deletion in the first exon that leads to an early stop codon. Black boxes represent exons, triangle shows the insertion site for elf6-3 and red arrows mark the start and end of the deleted region in elf6-C. Scale bar, 1 kb. (B) Schematic diagram of REF6 locus showing the location of different mutant alleles: ref6-5 (GABI_70E03) and ref6-1 (SALK_001018) are T-DNA insertions in the sixth and last exon, respectively. Black boxes represent exons and triangles shows the T-DNA insertion sites. Scale bar, 1 kb.
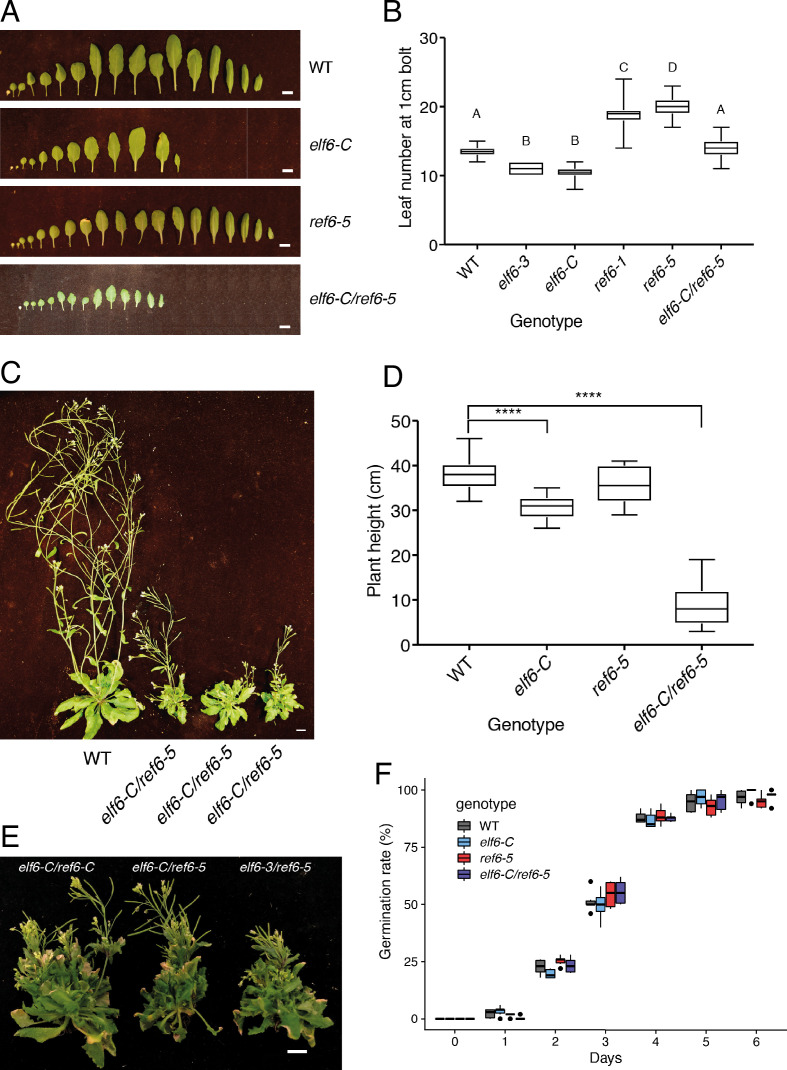
Figure 1—figure supplement 2. Phenotypic characterization of elf6-C, ref6-5 and double mutants.

Figure 1—figure supplement 2.

(A) Rosette leaves at bolting stage of Arabidopsis wild-type (WT) and histone demethylase mutants (elf6-C, ref6-5 and elf6-C/ref6-5). Scale bars, 1 cm. (B) Boxplot for leaf number at bolting stage for wild-type (WT) and different mutants. Letters represent groups of statistically significantly different samples. Differences between genotypes determined by Students t-test, using a sample size of n = 30. (C) Growth phenotypes of wild-type (WT) and elf6-C/ref6-5 mutant. Scale bar, 1 cm. (D) Boxplot of plant height for wild-type (WT) and histone demethylase mutants. Asterisks represent significant differences between samples. Differences between genotypes determined by Students t-test test, ****p<0.001, sample size of n = 30. (E) Growth phenotypes of elf6-C/ref6-C, elf6-C/ref6-6 and elf6-3/ref6-5 double mutants. Scale bar, 1 cm. (F) Boxplot of seed germination rates in wild-type (WT) and histone demethylase mutants. Germination was scored as radicle protrusion through seed coat. n = 300 from six biological replicates.
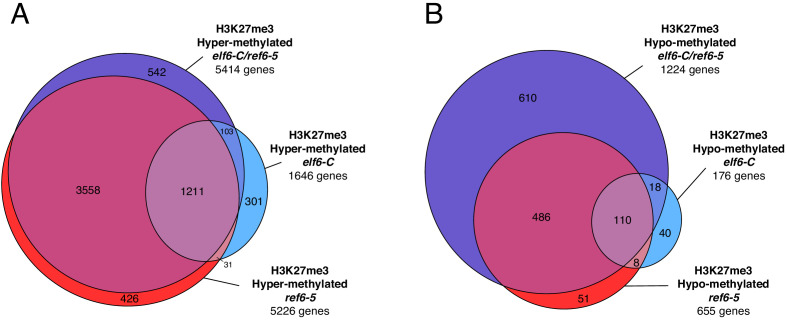
Figure 1—figure supplement 3. Genes with differential K3K27me3 methylation in histone demethylase mutants.

Figure 1—figure supplement 3.

(A) Euler diagram of H3K27me3 hyper-methylated genes in histone demethylase mutants compared to wild-type (WT). (B) Euler diagram of H3K27me3 hypo-methylated genes in histone demethylase mutants compared to wild-type (WT).
Figure 1—figure supplement 4. Genomic regions accumulating K3K27me3 in histone demethylase mutants.

Figure 1—figure supplement 4.

(A) Genome browser view of ChIP-seq signal as normalized reads per genomic content (RPGC). Shaded red boxes, genes targeted by REF6. (B) Genome browser view of ChIP-seq signal as normalized reads per genomic content (RPGC). Shaded blue box, gene targeted exclusively by ELF6. (C) Genome browser view of ChIP-seq signal as normalized reads per genomic content (RPGC). Shaded purple boxes, genes targeted by both REF6 and ELF6, and only hyper-methylated in the double mutant elf6-C/ref6-5.
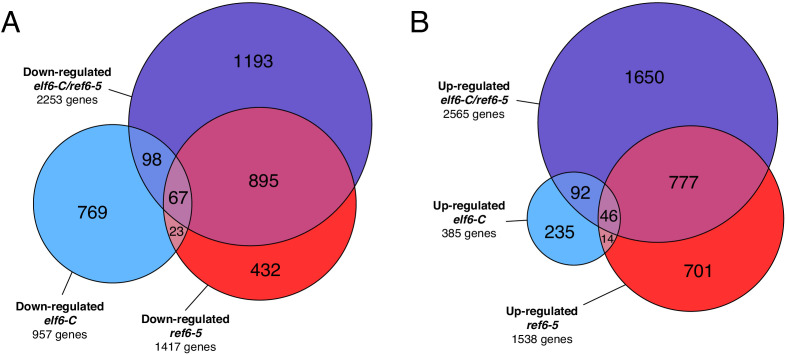
Figure 1—figure supplement 5. Genes differentially expressed in histone demethylase mutants.

Figure 1—figure supplement 5.

(A) Euler diagram of down-regulated genes in histone demethylase mutants compared to wild-type (WT). (B) Euler diagram of up-regulated genes in histone demethylase mutants compared to wild-type (WT).
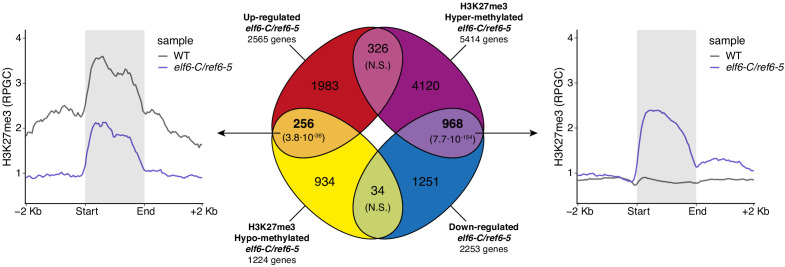
Figure 1—figure supplement 6. Relation between hypermethylation of H3K27me3 and downregulation of genes in elf6-C/ref6-5.

Figure 1—figure supplement 6.

Venn diagram showing overlap between differentially expressed genes (DEGs) and H3K27me3 differentially methylated genes in elf6-C/ref6-5. Venn diagram showing overlap between differentially expressed genes (DEGs) and H3K27me3 differentially methylated genes in elf6-C/ref6-5. To the left metaplot for H3K27me3 levels for genes both up-regulated and hypo-methylated and to the right metaplot of H3K27me3 levels in genes both down-regulated and hyper-methylated. p-values for Fisher’s exact test are shown in brackets, N.S. Not Significant.