. 2020 Oct 27;9:e58533. doi: 10.7554/eLife.58533

Figure 2. Arabidopsis REF6 plays an essential role in the deposition of H3K27me1 in active chromatin.

(A) Genome browser views of background subtracted ChIP-seq signals for H3K27me3 and H3K27me1 as normalized reads per genomic content (RPGC) in wild-type (WT) and histone demethylase mutants (elf6-C, ref6-5 and elf6-C/ref6-5). Shaded boxes, genes targeted exclusively by REF6. (B) Violin plots showing the distribution of H3K27me3 and H3K27me1 on genes targeted by REF6. Genes were categorised as targeted if a H3K27me3 peak was annotated on them in ref6-5 and in elf6-C/ref6-5 but not in WT. (C) Heatmap showing the distribution of H3K27me3 and H3K27me1 on genomic sequences targeted by REF6 for wild-type (WT), ref6-5, and clf/swn plants. Sample size n = 3385. (D) Bar charts showing the number of genes for different expression quantiles predicted to be targeted by PRC2 and REF6. (E) Heatmap showing the distribution of H3K27me3 and H3K27me1 present on genes corresponding to low-expression (1-5) quantiles. .

Figure 2.

Figure 2—figure supplement 1. REF6 catalyses H3K27me3 to H3K27me1 conversion in genes causing de-repression.

Figure 2—figure supplement 1.

(A) Heatmap showing the distribution of H3K27me3 (red) and H3K27me1 (green) on genes targeted by REF6. Genes were categorised as targets if a H3K27me3 peak was annotated on them in ref6-5 and in elf6-C/ref6-5 but not in WT. n = 1589. Intensity of the colour represents RPGC of ChIP-seq. Genes are sorted by the amount of H3K27me3 in WT. Boxes at the top represent metaplots of the average signal for all these genes. (B) Metaplot of median of H3K27me3 and H3K27me1 across both downregulated and hypermethylated genes in elf6-C/ref6-5 for wild-type (WT) and histone demethylase mutants, n = 968. (C) Heatmap of the same genes as Fig S 7B. Intensity of the colour represents ChIP-seq signal as RPGC. (D) Metaplot of median of H3K27me3 and H3K27me1 across both upregulated and hypomethylated genes in elf6-C/ref6-5 for wild-type (WT) and histone demethylase mutants, n = 256. (E) Heatmap of the same genes as Fig S 7D. Intensity of the colour represents ChIP-seq signal as RPGC.
Figure 2—figure supplement 2. ATXR5/6 contributes to the deposition of H3K27me1 in pericentromeric regions.

Figure 2—figure supplement 2.

(A) Distribution of H3K27me1 across chromosomes of wild-type (WT) and atxr5/6 mutants. Grey shaded boxes, pericentromeric regions. (B) Distribution of H3K27me1 across Chromosome 4 of Arabidopsis genome in wild-type (WT) and atxr5/6 mutants. Grey shaded boxes, pericentromeric regions.
Figure 2—figure supplement 3. Division of Arabidopsis genes according to their levels of expression.

Figure 2—figure supplement 3.

Violin plot with boxplots representing the expression levels of genes in Arabidopsis divided in 10 quantiles.
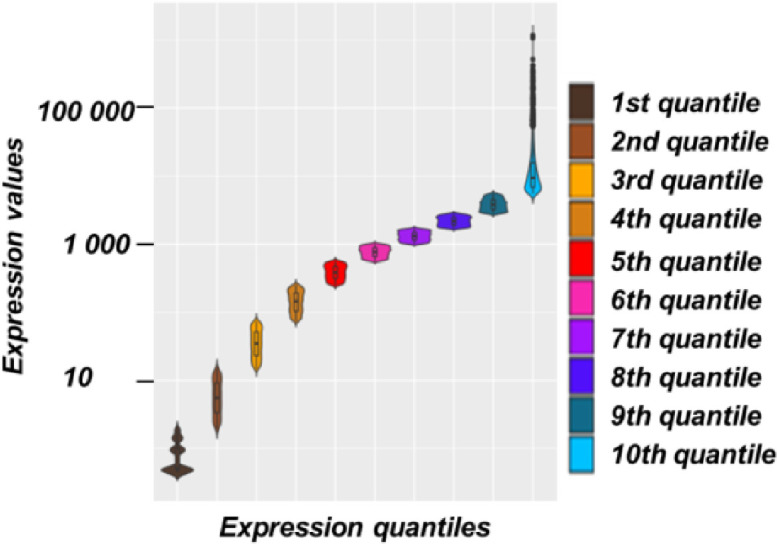
Figure 2—figure supplement 4. Histone demethylase mutants show an increase in H3K27me3 on genes with intermediate levels of expression Heatmaps showing the H3K27me3.

Figure 2—figure supplement 4.

ChIP-seq signal across genes split by 10 quantiles of expression for wild-type (WT) and histone demethylase mutants. Boxes on top represent metaplots of the median signal in each quantile. Genes are sorted by the amount of H3K27me3 in WT. (A) WT. (B) elf6-C. (C) ref6-5. (D) elf6-C/ref6-5.
Figure 2—figure supplement 5. Distribution of different epigenetic features for different expression quantiles.

Figure 2—figure supplement 5.

Heatmaps showing signal for different epigenetic features across 10 expression quantiles for wild-type. Boxes on top represent metaplots of the median signal in each quantile. Genes in all panels are always sorted by the amount of H3K27me3. (A) H3K27me3. (B) H3K27me1. (C) H3K9ac. (D) ATAC-seq. (E) PolII-seq. (F) Mnase-seq.