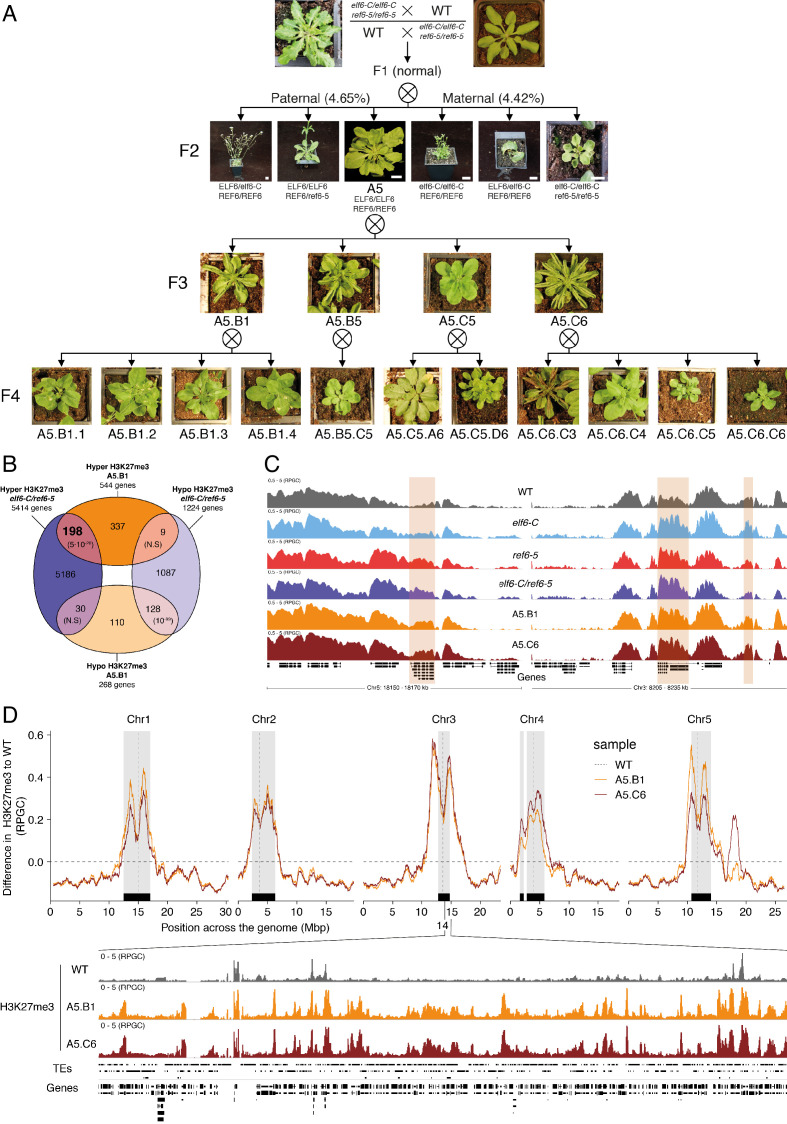
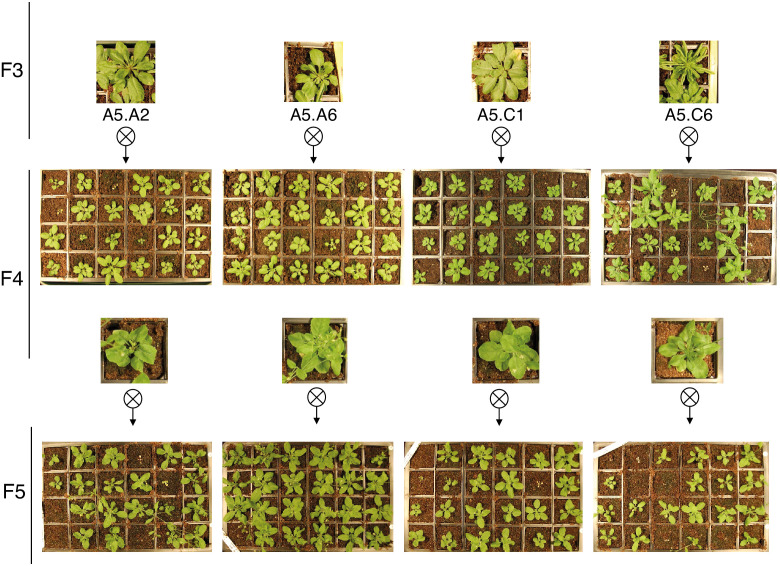
Figure 3. Pleiotropic developmental abnormalities associated with the inheritance of ectopic H3K27me3 imprints in Arabidopsis.
(A) The F2 hybrids from reciprocal crosses between wild-type (WT) and elf6-C/ref6-5 display novel abnormal plant growth phenotypes. Frequency of abnormal phenotypes according to parental transmission of mutant alleles is indicated. Pedigree of an epimutant that was genetically wild-type for ELF6 and REF6 and selected for genomic analysis after propagation by selfing. Scale bars, 1 cm. (B) Venn diagram showing the overlap in genes accumulating H3K27me3 in elf6-C/ref6-5 and F5 progenies from A5.B1. p-values for Fisher’s exact test are shown in brackets, N.S. Not Significant. (C) Genome browser views of background subtracted ChIP-seq signals for H3K27me3 as normalized reads per genomic content (RPGC) in wild-type (WT), elf6-C, ref6-5, elf6-C/ref6-5, and F5 progenies from A5.B1 and A5.C6. Shaded boxes, genes showing transgenerational inheritance of H3K27me3. (D) Top panel: Differences in the chromosomal distribution of H3K27me3 as normalized reads per genomic content (RPGC) between F5 progenies from A5.B1 and A5.C6 and wild-type (WT). Grey shaded boxes, pericentromeric regions. Bottom panel: Genome browser view of ChIP-seq signal for H3K27me3 as normalized reads per genomic content (RPGC) in wild-type (WT), and F5 progenies from A5.B1 and A5.C6 in a pericentromeric region.


