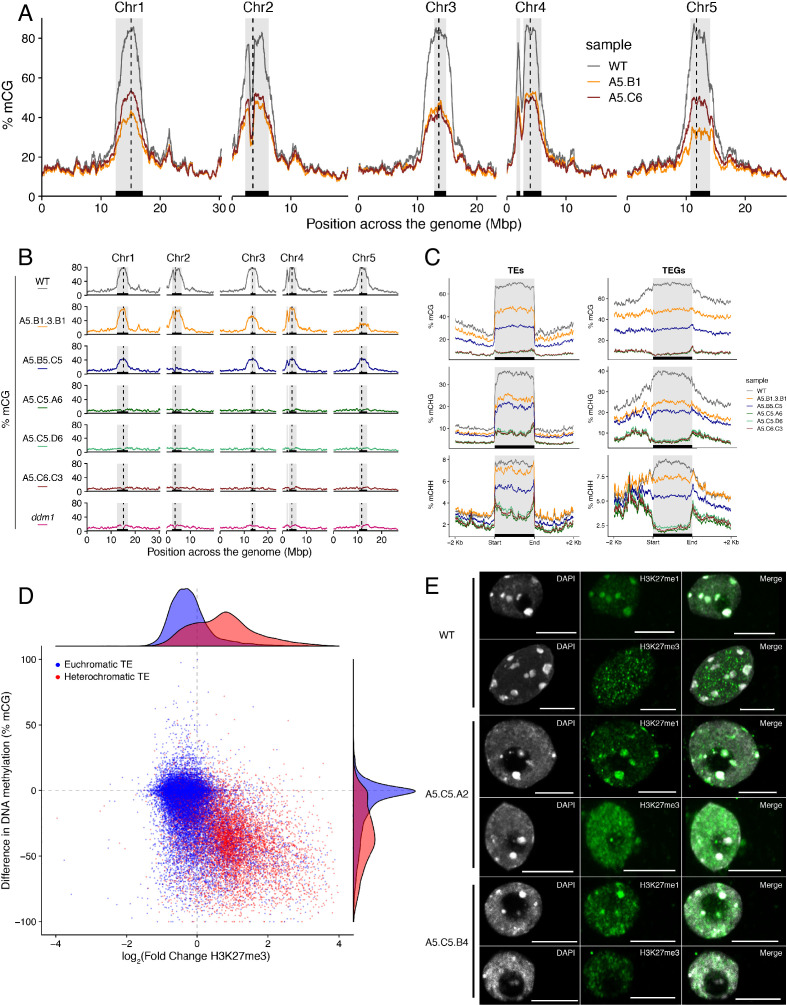
Figure 4. Ectopic accumulation of H3K27me3 is associated with the loss of DNA methylation at pericentromeric heterochromatin and affects chromatin condensation.
(A) Distribution of DNA methylation across chromosomes of wild-type (WT) and progenies from epiERs A5.B1 and A5.C6. Grey shaded boxes, pericentromeric regions. (B) Distribution of DNA methylation across chromosomes of individual plants from wild-type (WT), ddm1, and epiERs A5.B1.3.B1, A5.B5.C5, A5.C5.A6, A5.C5.D6 and A5.C6.C3. Grey shaded boxes, pericentromeric regions. (C) Distribution of DNA methylation across Transposable Elements (TEs) and Transposable Element Genes (TEGs) of individual plants from wild-type (WT) and epiERs A5.B1.3.B1, A5.B5.C5, A5.C5.A6, A5.C5.D6 and A5.C6.C3. Black box, centromeric regions. (D) Correlation between DNA methylation changes and H3K27me3 changes on euchromatic and heterochromatic TEs, in wild-type (WT) and epiER A5.B1. (E) Immunolocalization showing the distribution of H3K27me3 and H3K27me1 in interphase nuclei of wild-type, A5.C5.A2 and A5.C5.B4 plants. Scale bars, 5 μm.
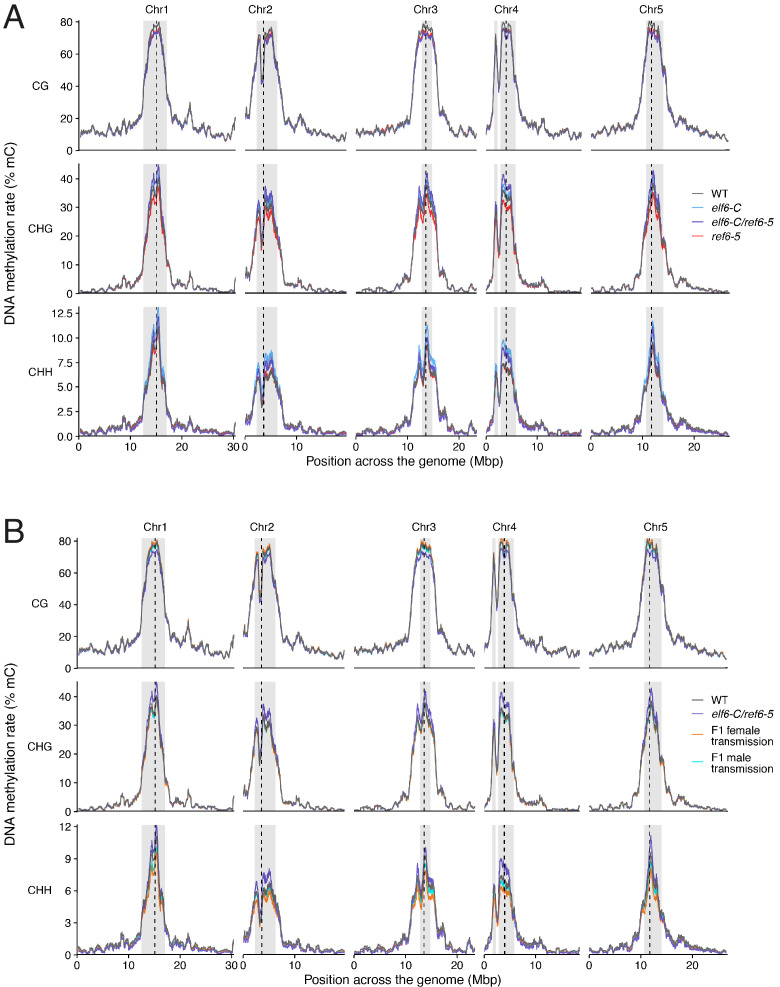
Figure 4—figure supplement 1. Chromosomal distribution of DNA methylation in histone demethylase mutants and F1 hybrids.
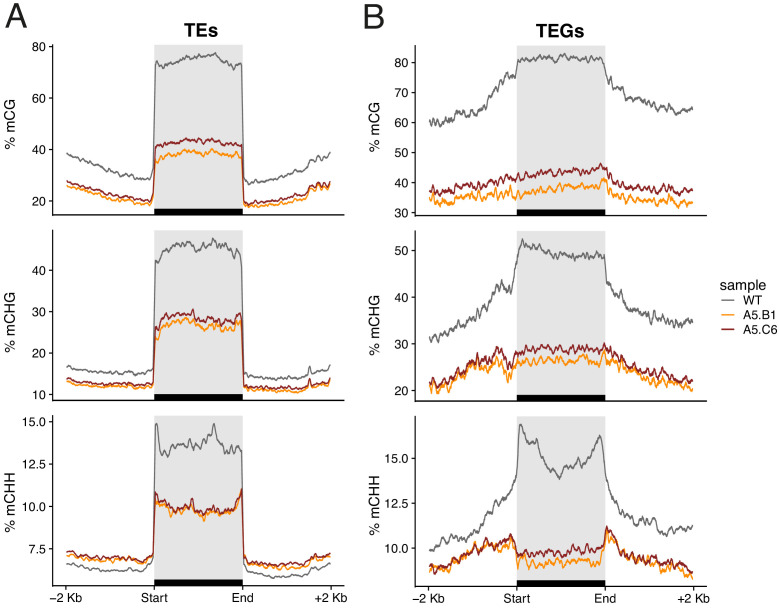
Figure 4—figure supplement 2. DNA hypomethylation of transposable elements in epiERs.
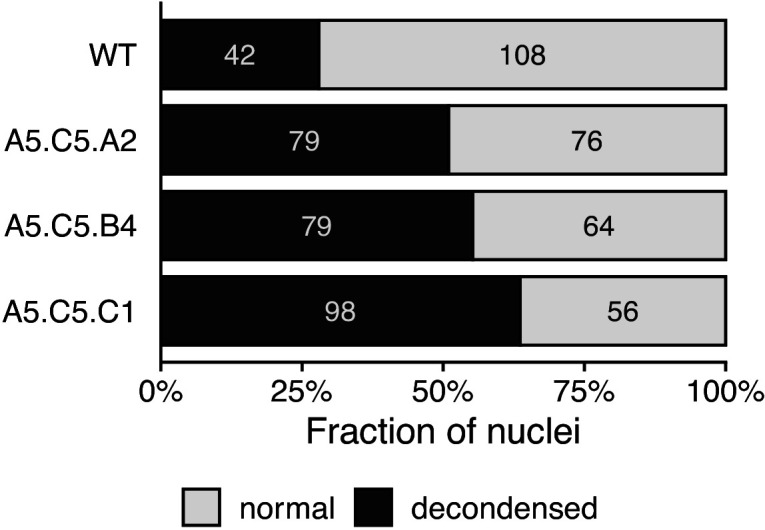
Figure 4—figure supplement 3. Condensation of chromatin in epiERs.


