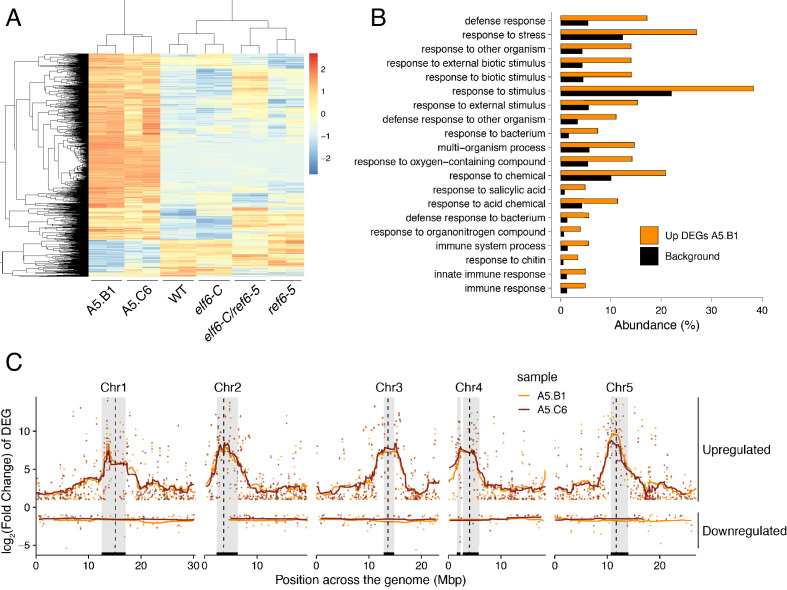
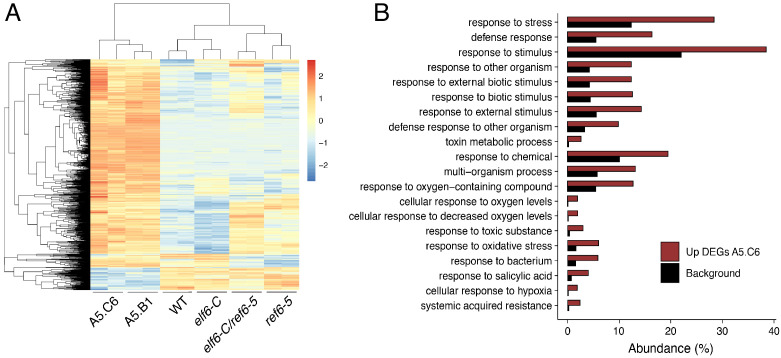
Figure 5. Global upregulation of centromeric gene expression in epiERs.
(A) Heatmap showing scaled expression levels of Differentially Expressed Genes between wild-type and progeny of epiER A5.B1 in wild-type (WT) elf6-C, ref6-5, elf6-C/ref6-5, and progenies of epiERs A5.B1 and A5.C6. (B) Gene Ontology analysis showing the functional categories enriched in genes upregulated in progeny of epiERs A5.B1. (C) Differential gene expression across each Arabidopsis chromosome for genes upregulated and downregulated in progenies of epiERs A5.B1 and A5.C6. Grey shaded boxes, pericentromeric regions.


