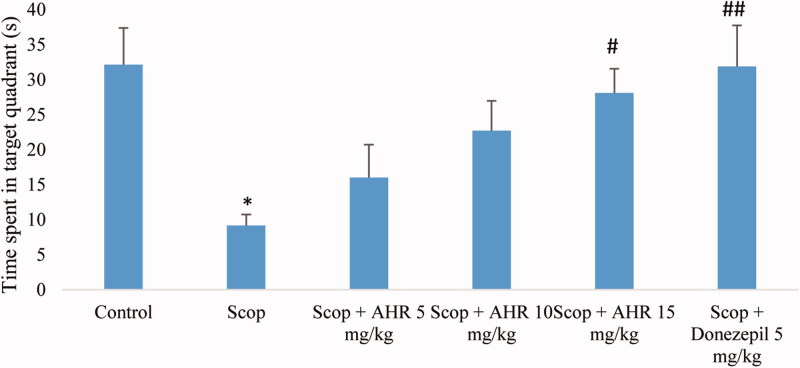
Figure 5.
The effect of AHR on the time spent swimming in the target quadrant during the probe-trial session of the Morris water maze test. Data are presented as mean ± SEM (n = 10 per group). *Significant difference from the control group (p < 0.05); significant difference from the scopolamine-treated group (#p < 0.05, ##p < 0.01, respectively).

