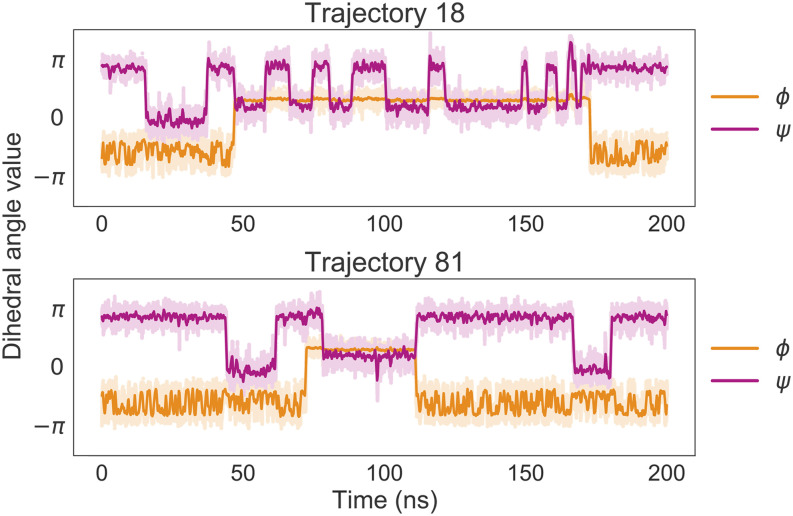
FIG. 3.
Two 100-ns trajectories simulated using a CGSchNet trained on atomistic data of capped alanine. The orange and magenta lines represent the value of the dihedral angles ϕ and ψ, respectively, over the course of each simulation. Relatively steep changes in the y-direction indicate transitions among basins; one can see that both trajectories feature multiple transitions in both reaction coordinates. A moving average of 250 simulation frames is used to smooth the darker curves.

