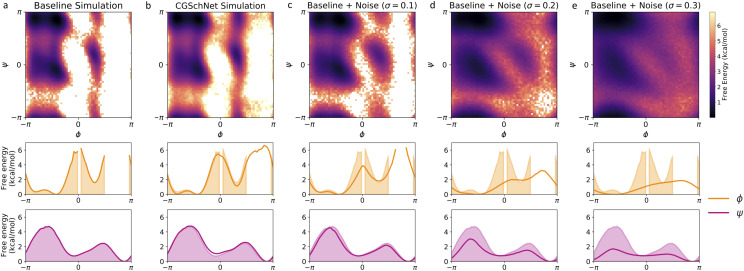
FIG. 4.
Two- and one-dimensional free energy surfaces for five capped alanine datasets. From left to right, datasets are the baseline all-atom capped alanine simulation (a), the coarse-grained CGSchNet simulation produced for analysis (b), and datasets generated from perturbations of the original Cartesian coordinates of the baseline dataset drawn from noise distributed as for σ = 0.1 Å (c), 0.2 Å (d), and 0.3 Å (e). To create each two-dimensional surface, the ϕ and ψ Ramachandran angles are calculated from the spatial coordinates and discretized into 60 × 60 regularly spaced square bins. The bin counts are converted to free energies by taking the natural log of the counts and multiplying by −kBT; the color scale is the same in all five two-dimensional surfaces and darker color represents lower free energy (i.e., greater stability). To obtain the one-dimensional ϕ and ψ landscapes, free energies are calculated for 60 regularly spaced bins along the reaction coordinate. The shaded region always represents the baseline dataset, and the bold line represents the dataset indicated in the inset title.

