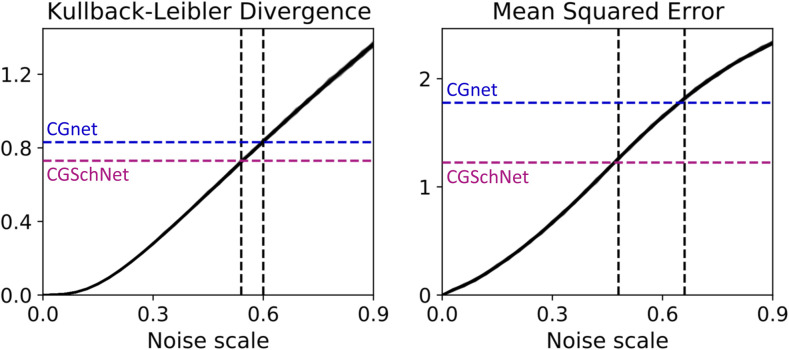
FIG. 8.
The Kullback–Leibler divergence (left) and mean squared error (right) are calculated between the baseline chignolin dataset and the datasets obtained from perturbations to the baseline simulation at noise scale values of σ ∈ {0, 0.03, 0.06, …, 0.90}, where the former is the reference distribution and the latter is the trial distribution. This procedure is performed 50 times with different random seeds; both plots show the superposition of those 50 lines. The colored horizontal dashed lines show the values of the metric when comparing the CGSchNet (purple) and the CGnet (blue) simulations to the baseline. The black vertical dashed line indicates the noise scale σ that returns the closest value for that metric. The KL divergence is computed for normalized bin counts in reweighted TIC 1 × TIC 2 space, and the MSE is computed for energies, as described in the main text.

