Figure 14.

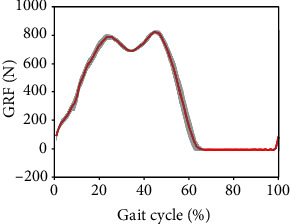
The mean (red) and standard deviation (shaded) of vertical GRF for the prosthesis user PRO1, trial 3, during the preferred walking speed of 0.8 m/s. The mean and standard deviation are calculated over 30 gait cycles.

The mean (red) and standard deviation (shaded) of vertical GRF for the prosthesis user PRO1, trial 3, during the preferred walking speed of 0.8 m/s. The mean and standard deviation are calculated over 30 gait cycles.