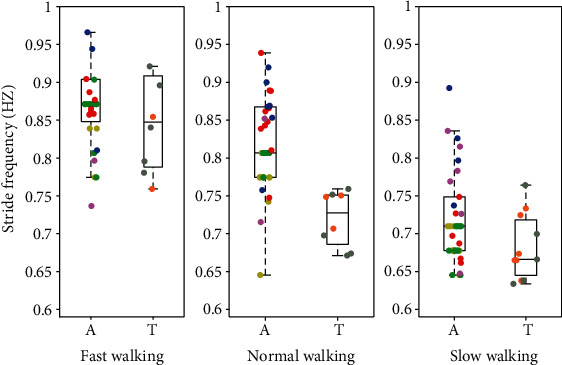
Figure 16.

Stride frequency of participants with intact limbs and prosthesis users at three speeds with the normal speed being their preferred speed. The data from participants with intact limbs is shown on the left (A) and transfemoral prosthesis user data is shown on the right (T) in each pair. The figure shows the median, along with a box that bounds the first and third quartiles of the data, and whiskers that bound the entire range of the data (apart from outliers). Moreover, the scatter plot shows the average stride frequency of each trial. The data for each subject are color-coded: yellow = AB01, green = AB02, red = AB03, blue = AB04, purple = AB05, brown = PR01, and gray = PR02.
