
Figure 3.
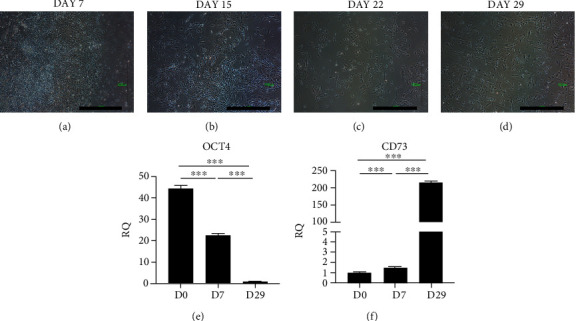
The process from iPSC to mesenchymal stem cell (MSC). (a) The fibroblastic morphology cells (Lt side of the figure) appeared on day 7 after differentiation around the epithelial round cell colony (Rt side of the figure). (b) At day 14, more fibroblast-like cells appeared. (c) At day 21, around 100% of cells were fibroblastic appearance cells. (d) On day 29, fully differentiated MSC were noted. Scalebar = 1000μm. (e) qPCR showed a decreasing trend of pluripotency gene (OCT4) expression from postdifferentiation day 7 to day 29. (f) qPCR showed an increasing trend of MSC gene (CD73) expression from postdifferentiation day 7 to day 29. ∗∗∗p < 0.001. We used an ANOVA test with a post hoc analysis with the Bonferroni test.