
Figure 6.
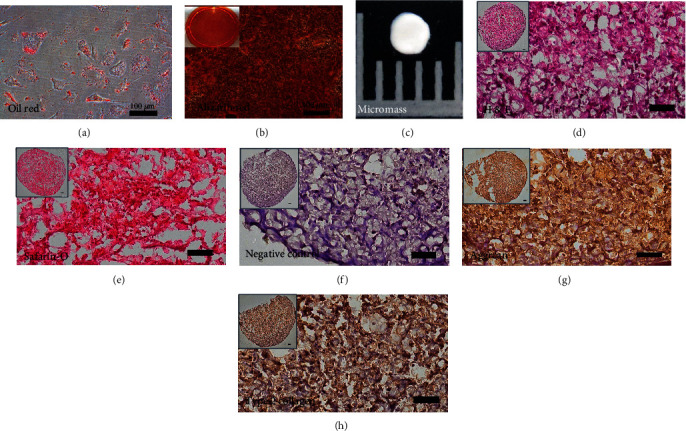
Trilineage differentiation of iPSC-derived MSCs. (a) After the adipogenesis of iPSC–MSC for 2 weeks, the oil droplets in the cells were staining positive for Oil red. Scalebar = 100μm. (b) After the osteogenesis of iPSC–MSC for 2 weeks, the mineral deposition in cells was staining positive for Alizarin Red. Insert picture was Alizarin Red staining of one well of a 6-well plate. Scalebar = 100μm. (c) After chondrogenesis of iPSC-derived MSCs for 21 days, the iPSC–MSC formed a cartilage micromass. The picture is 5 mm in length. (d) The Hematoxylin and Eosin (H & E) staining of the micromass. (e, g, h) Micromasses were positive for sulfated glycosaminoglycans (Safranin O) (e), aggrecan (g), and type 2 collagen (h). (f) Negative control staining for immunohistochemistry (without the first antibody). Insert pictures in (d–h) were the picture of the whole micromass section. Scalebar = 100μm.