
Figure 9.
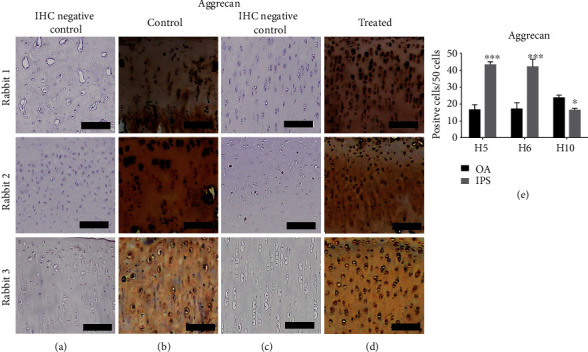
The immunohistochemistry (IHC) in iPSC–MSC-chondrocytes transplant cartilages (n = 3). (a, b) The IHC of aggrecan in control cartilage with IHC-negative control (a) and staining cartilage (b). (c, d) IHC of aggrecan in treated cartilage with IHC-negative control (c) and staining cartilage (d). Scalebar = 100μm. (e) Quantification of aggrecan+ cells in 50 cells. More aggrecan+ cells/50 cells were noted in rabbit 1 and 2. ∗p < 0.5, ∗∗∗p < 0.01. Statistical analyses between both groups were calculated with Mann–Whitney U test.