
. 2020 Nov 7;2020:9328414. doi: 10.1155/2020/9328414
Copyright © 2020 Mohd Izhan Mohd Yusoff.
This is an open access article distributed under the Creative Commons Attribution License, which permits unrestricted use, distribution, and reproduction in any medium, provided the original work is properly cited.
Figure 6.
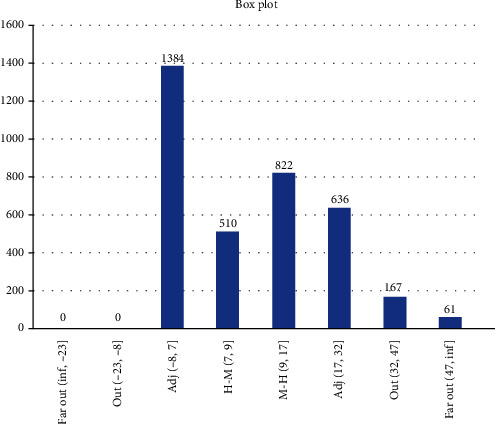
Box plot showing Scenario 1 data.