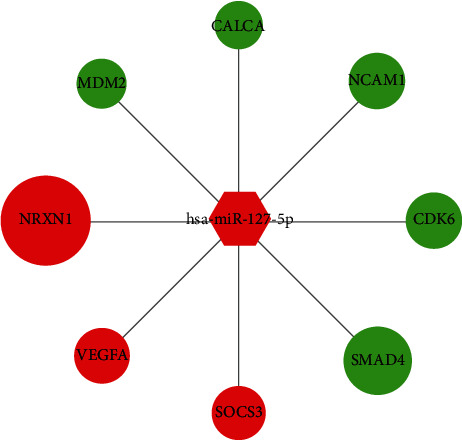
Figure 4.

The key miRNA-target interaction regulatory network. (The size of each node was proportional to |log(fold change)| value. The green color indicates downregulation, and the red color indicates upregulation. The circular node represents key mRNA, and the hexagon node represents miRNA.)
