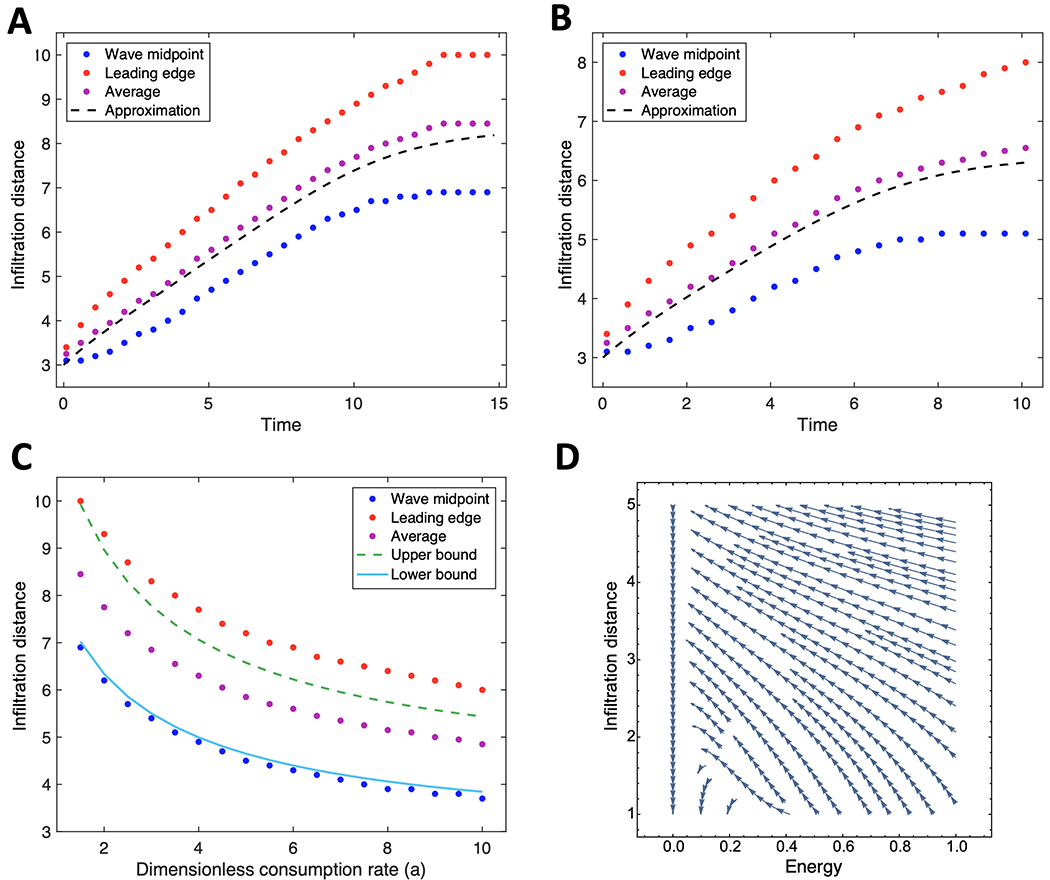
Figure 2:

Comparing analytical approximations of the degree of infiltration with those obtained from simulations.(A-B) Traveling-wave solutions at energy consumption rates a = 1.5 (A) and a = 3.5 (B). (C) Upper and lower boundaries of traveling wave solutions estimated from equilibration are shown as a function of consumption rate. Approximation is found by lower and upper bound Λ = 0,1 from equation(4). (D) Phase diagram of energy consumption and front location using the derived coupled system(3a)-(3b). (A-D) All approximations and simulations assume energy is uniformly distributed at all times, i.e. chemotaxis does not take place. Parameter values for initial seeding radius (ρ0), dish radius (R), and sensitivity to low energy (φ) are set to 3, 10 and 0.05 respectively. Red = leading edge of wave (estimated by finding value of cell concentration closest to 0.01); blue = midpoint of wave (estimated by finding value of cell concentration closest to 0.5); purple = average of red and blue; black lines are approximations based on analytical solutions. Time is in units of the maximal growth rate of the given cell line. Front location is given in units of the characteristic length .
