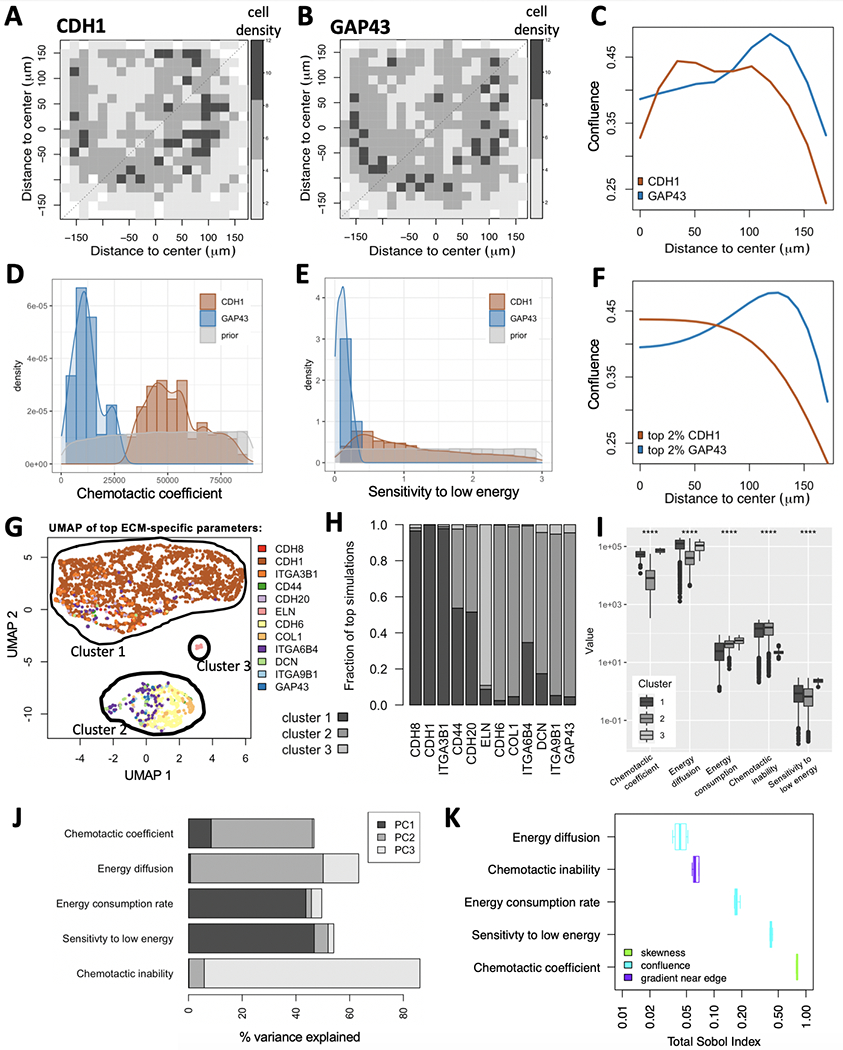
Figure 3:

Model calibration using MEMA profiling of HCC1954 cells. (A-C) Experimentally measured data. Variability in cell growth patterns across ECMs is demonstrated via two example ECMs: CDH1 (A) and GAP43 (B). The average local cell densities are displayed for both (color legend). (C) Projecting their 2D spatial distributions onto 1D reveals enrichment of cells at the edge of the ECM spot for GAP43, but not for CDH1. (D-F) Simulated data. Comparing prior-distribution of chemotactic coefficients (D) and sensitivity to low energy (E) to ECM-specific posterior distributions reveals clear differences between CDH1 and GAP43 for both parameters. (F) Maximum-likelihood parameter choices for CDH1 and GAP43 result in distinct spatial distributions between the two ECMs, each of which resemble the measured distributions (C). (G-I) ECM specific model parameters. Simulations were compared to each measured ECM-specific growth pattern and ranked by their maximum similarity. (G-H) The five model parameters from the top 2.3% simulations were projected onto UMAP space, revealing three clusters. Color-coding simulations by the ECM responsible for their presence in the top simulations suggests enrichment of most ECMs to only a single cluster (G). (H) This was confirmed when comparing cluster membership across the 12 represented ECMs. (I) All five model parameters (x-axis) show significant differences between the three clusters (****: p <= 0.0001). (J-K) Parameter sensitivity analysis. (J) The % variance explained per parameter shows significant contribution of all five model parameters to at least one of the first three principal components (PCs). (K) The Sobol index (x-axis) tells us which parameter best explains which aspect of the cells’ spatial distribution (color-code): its skewness, confluence or gradient near the edge.
