Figure 4:

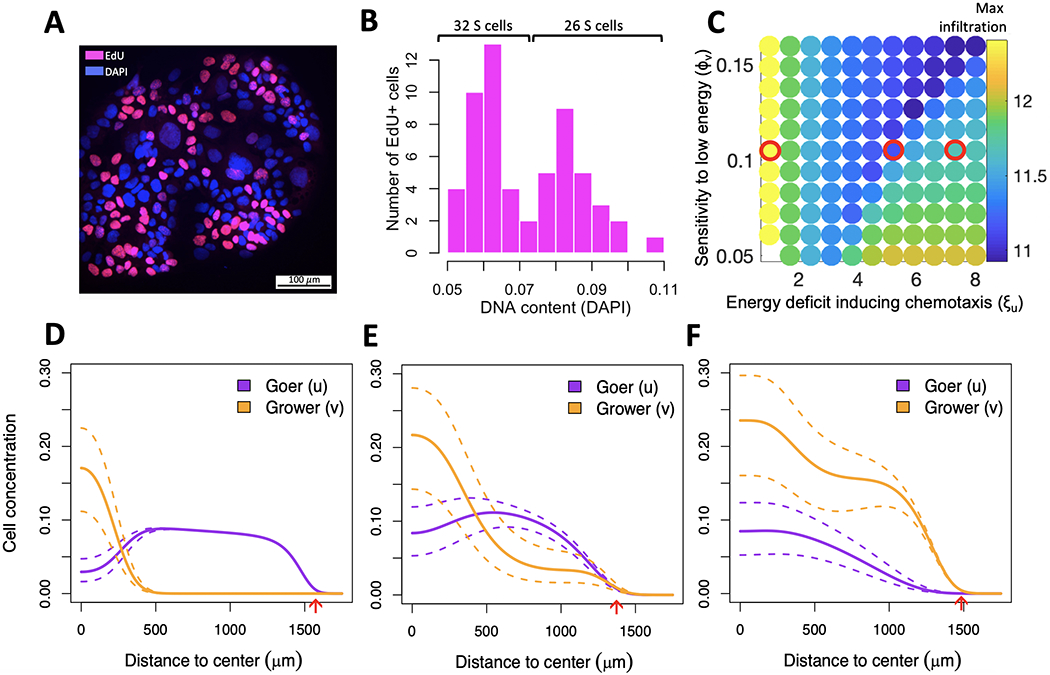
Internal competition of co-existing subpopulations for same space slows down invasion of the metapopulation. (A) DNA content and cell cycle state of 162 cells growing on HGF-exposed ICAM1. (B) DAPI intensity of 58 replicating (EdU+) cells shows a bimodal distribution, indicating the presence of two subpopulations -- a low-ploidy population (grower) comprising ~55\% cells and a high-ploidy population (goer) comprising ~45\% cells. (C) Arms race between the grower’s energetic sensitivity (y-axis) and the goer’s chemotactic ability (x-axis) reduces infiltration distance (color bar). Red circles outline parameter combinations of interest explored in (D-F). (D-F) Spatial distribution of goer and grower for parameter values outlined in (C). Dotted lines outline extreme trajectories of expected cell concentrations due to incertitude in initial goer/grower proportions, as estimated from the silhouette coefficient of cells in panel B (see also Supplementary Fig. 6B). (D) High chemotactic motility will cause the goer to leave the center of the dish too soon, leaving room for the grower to expand there. (E) With an intermediate motility the goer succeeds maintaining high representation both at the center and edge of the dish. (F) Low motility will prevent the goer from gaining a sufficient spatial lead from the grower while energy is still abundant, and it will lose dominance at the edge of the dish once energy becomes sparse. Red arrows indicate maximum infiltration distance achieved by either of the two populations.
