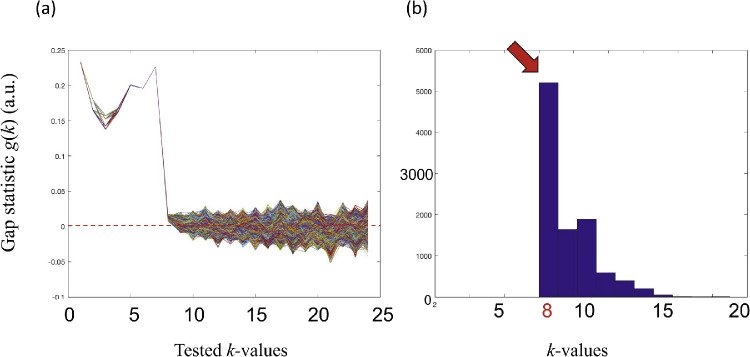
Figure 2.
Gap-statistics analysis for k = 2 to 24. (A) Trace of gap statistic values for 10,000 calculations. The horizontal and vertical axes represent the k-values tested and gap-statistic value for each k, respectively. (B) Histogram of cluster numbers (k), which was the smallest number before the gap-statistic value fell from a positive value to a negative value in each calculation. The most frequent number of clusters was k = 8.

