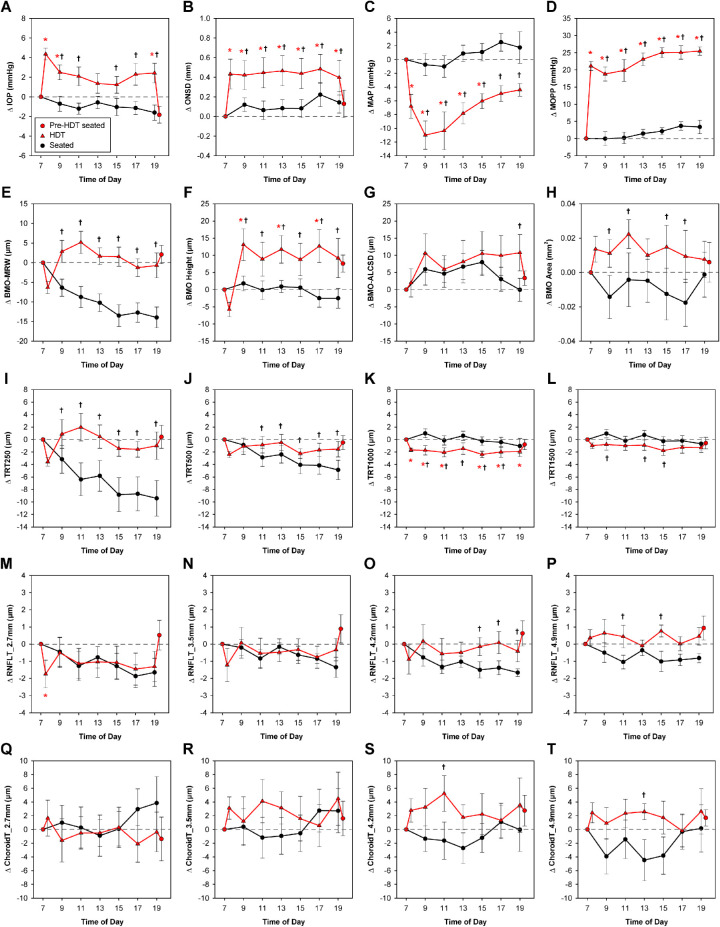
Figure 4.
Changes in parameters over 12 hours in a head-down tilt versus seated position. Red plots depict mean change ± standard error from the 7 a.m. seated baseline for parameters obtained during the HDT experiment (n = 10). Circles represent data obtained in a seated position, and triangles represent data obtained in an HDT position. Parameter values at each time point were compared to those obtained at the 7 a.m. seated baseline, and statistically significant differences are denoted with a red asterisk (P < 0.05). Additionally, black plots show data obtained over 12 hours in a seated position for the same 10 subjects; a significant difference in change from baseline between the seated and HDT conditions is denoted with a black dagger. RNFLT = retinal nerve fiber layer thickness; ChoroidT = choroid thickness.

