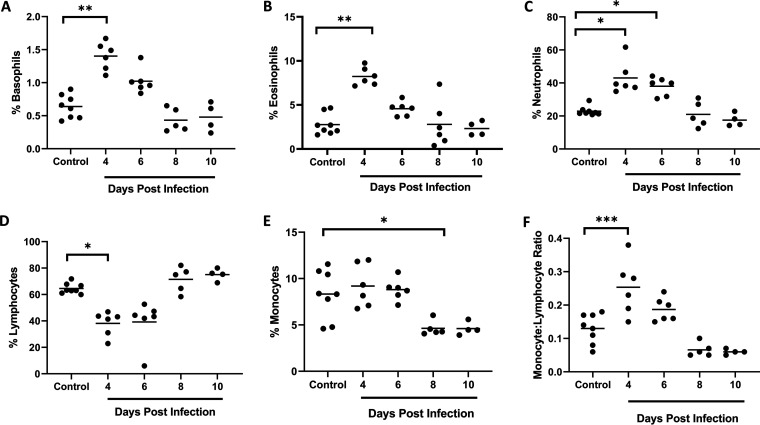
FIG 4.
Circulating leukocytes in P. yoelii yoelii 17XNL-infected and control, uninfected mice. (A to F) The x axis represents the time points in days after infection, and the y axis represents the percentages of circulating basophils (A), eosinophils (B), neutrophils (C), lymphocytes (D), and monocytes (E) and monocyte/lymphocyte ratios (F). Each dot represents a single mouse. Data were analyzed with the Kruskal-Wallis test followed by Dunn’s multiple comparison of each time point with the control group. P values of <0.05 were considered significant. *, P ≤ 0.05; **, P ≤ 0.01; ***, P ≤ 0.001.

