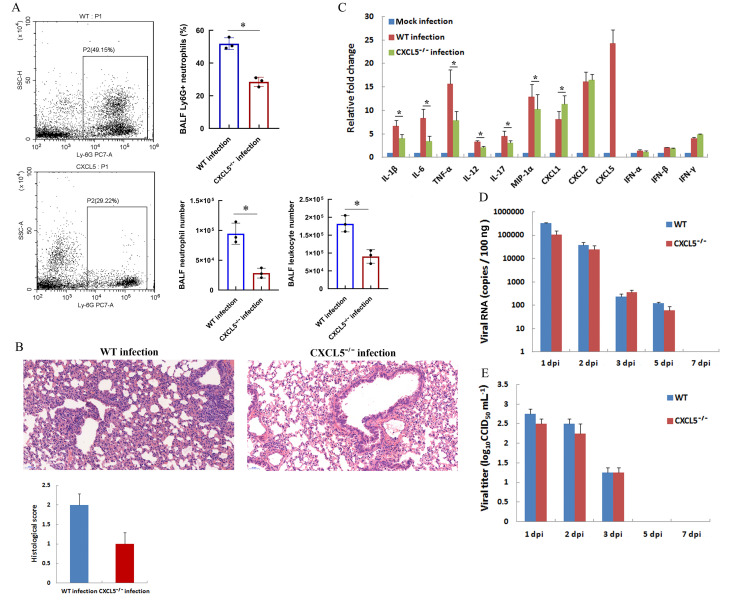
Figure 4.
Comparison of SARS-CoV-2 infection in hACE2-transfected WT mice and CXCL5−/− mice
Two days (48 h) after in vivo transfection with hACE2 plasmid, WT and CXCL5-knockout mice (CXCL5−/−) were intranasally infected with SARS-CoV-2 (1×10⁵ CCID50). A: Percentages of neutrophils (Ly6G antibody-positive) from two infected mouse strains at 2 dpi were analyzed by flow cytometry (left) and calculated from triplicate samples (right). Total numbers of leukocytes and neutrophils in BALF of infected mice at 2 dpi were counted (lower right). B: Lungs were harvested from infected mice at 2 dpi, fixed in formalin, and embedded in paraffin. Lung sections were stained with hematoxylin and eosin for histopathological analysis (original magnification, 20×). Lung histological scores were assessed by a veterinary pathologist blind to the study, as described in the Methods and Materials section. C: mRNAs levels of indicated cytokines in lung tissue homogenates of infected mice at 2 dpi were examined by qRT-PCR (normalized to β-actin). Mock-infected mice were transfected with control pCMV3 plasmid. D, E: Lungs were harvested at different dpi, viral RNA was determined based on number of nucleocapsid (n) gene RNA copies detected by qRT-PCR (D), and viral titers were determined using a CCID50 assay (E). Error bars indicate standard deviation of triplicate biological samples. *: P<0.05 based on Student’st-test.

