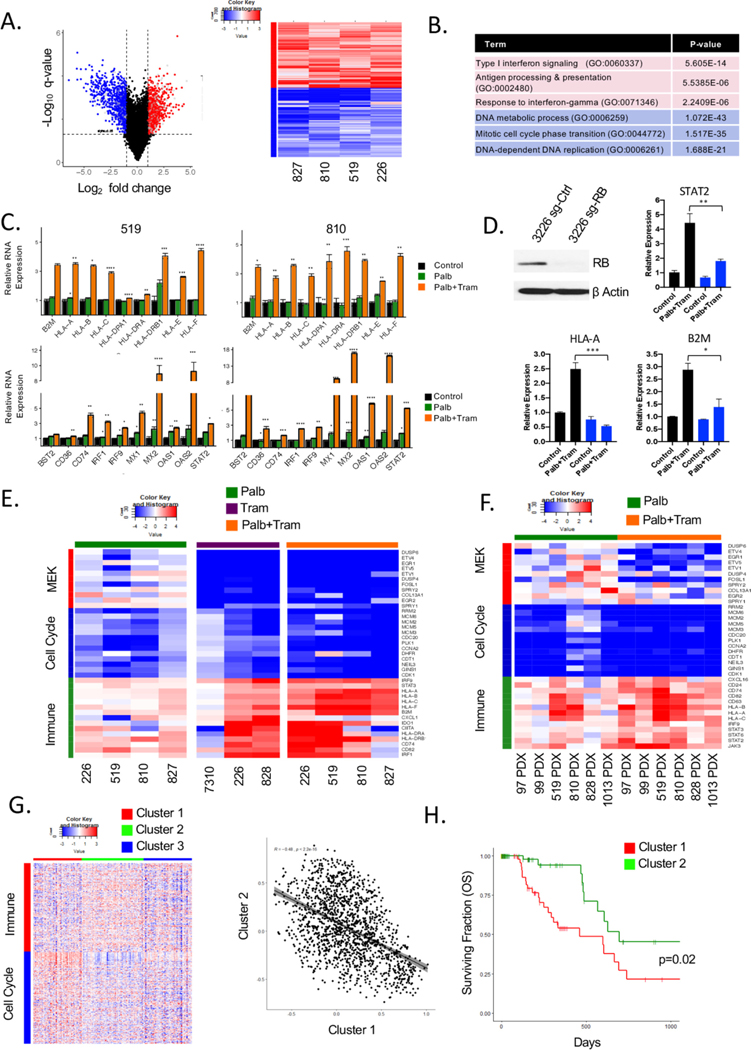
Figure 3.
Induction of immunological genes in an RB-dependent manner in PDAC models treated with MEK and CDK4/6 inhibitors. (A) Common genes significantly induced or repressed in palbociclib and trametinib-treated cell lines were determined using an average log 2 fold-change greater than 1 and a false-discovery rate less than 5% were considered to be differentially expressed. The blue symbols denote repressed cell-cycle genes and the red symbols denote induced genes associated with the immune system. (right panel) Heatmap comparing the log 2 fold change of genes related to immune function (red-colour bar) and cell cycle (blue-colour bar) in palbociclib+trametinib-treated cell PDAC cell line models. (B) Top gene ontology terms related to the immune system and cell cycle ranked based on p-value. (C) Relative mRNA expression of palbociclib (green) and palbociclib+trametinib (orange) treated cells for a subset of genes related to antigen presentation and Interferon signalling (*p≤0.05,**p≤0.01, ***p≤0.001,****p≤0.0001, determined by Student t-test two-sided, the average and SD are shown). (D) qRT-PCR for the immune-related genes were performed in 3226 cell line with CRISPR-mediated deletion of RB treated with palbociclib+trametinib (*p<=0.05,**p<=0.01,***p<=0.001, determined by Student t-test two-sided, the average and SD are shown). (E) Heatmap showing the log fold change of representative MEK target genes (red colour-bar), cell cycle (blue colour-bar) and immune function (green colour-bar) with the indicated treatments across cell line models. (F) Heatmap showing the log fold change of representative MEK target genes (red colour-bar), cell cycle (blue colour-bar) and immune function (green colour-bar) with the indicated treatments across PDX models. (G) Heatmap showing K-means clustering of TCGA pancreatic cancer cohort based on significant genes altered with palbociclib+trametinib treatment related to immune function (red colour-bar) or cell cycle (blue colour-bar). Pearson correlation between cluster 1 and cluster 2 with a negative correlation of −0.48 and significance p<2.2e−16. (H) Kaplan-Meier analysis for overall survival comparing cluster 1 and cluster 2 from the heatmap. PDAC, pancreatic ductal adenocarcinoma.

