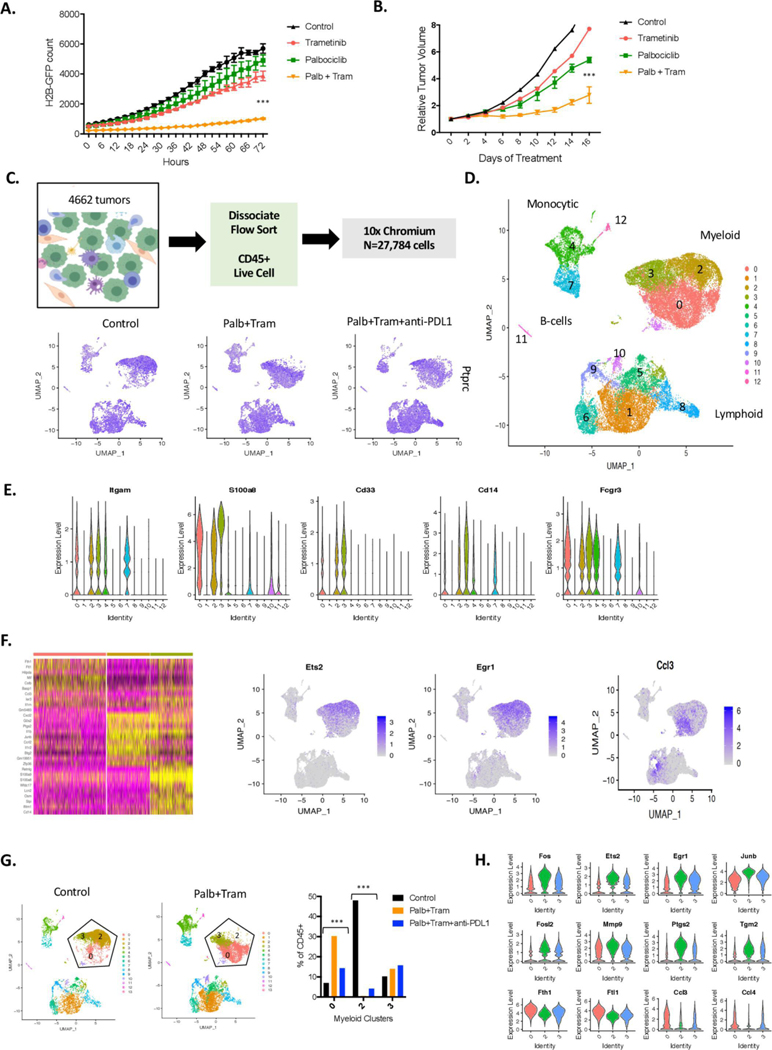
Figure 4.
Impact of CDK4/6 and MEK inhibition on the tumour microenvironment. (A) The KPC-derived 4662 cell line labelled with H2B-GFP was treated with palbociclib, trametinib or the combination. Cellular proliferation was determined using IncuCyte live cell imaging over the indicated time frame (***p<0.001, by Student t-test relative to the single-agent controls). (B) The 4662 model was introduced into C57BL/6J mice subcutaneously, mice were randomised at approximately 200 mm3 and tumour volume was measured by callipers with mice on treatment (***p<0.001 for the combination relative to vehicle control by Student t-test). (C) Schematic workflow for the single-cell sequencing. Feature plots denote the expression of PTPRC (CD45 gene) in all of the captured cells with treatment. (D) All of the cells from the treated mice were filtered for quality and clustered using Seurat software in the dimension plot. The general clustering of different immunological subtypes is indicated. (E) The violin plots denote gene markers associated with myeloid, neutrophil and macrophage populations. (F) Seurat heatmap identifying top differences between the myeloid clusters (0, 2 and and representative feature plots are shown). (G) Distribution of cells in the indicated myeloid clusters, changes in clusters 0 and 2 with treatments are highly significant by χ2statistic (***p<1E−100). (H) Genes differentially expressed in cells between clusters 2 and 0 are highlighted in the violin plot (all genes are highly significant between the clusters p<1E−5).

