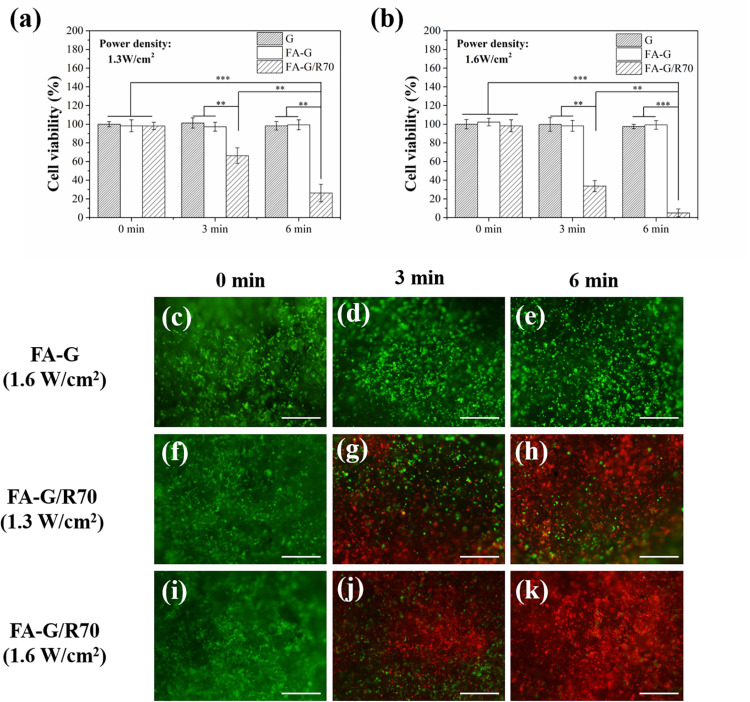
FIGURE 5.
Cell viability of MDA-MB231 cells in the G, FA-G, and FA-G/R70 scaffolds with different laser irradiation for 0, 3, and 6 min. (a) 1.3 W/cm2 laser power intensity, (b) 1.6 W/cm2 laser power intensity. (c–k) Live/dead staining of MDA-MB231 cells in FA-G and FA-G/AuNRs70 with laser irradiation for 0, 3, and 6 min. Scale bar: 100 μm. Data represent means ± SD (n = 3). **P < 0.01; ***P < 0.001.

