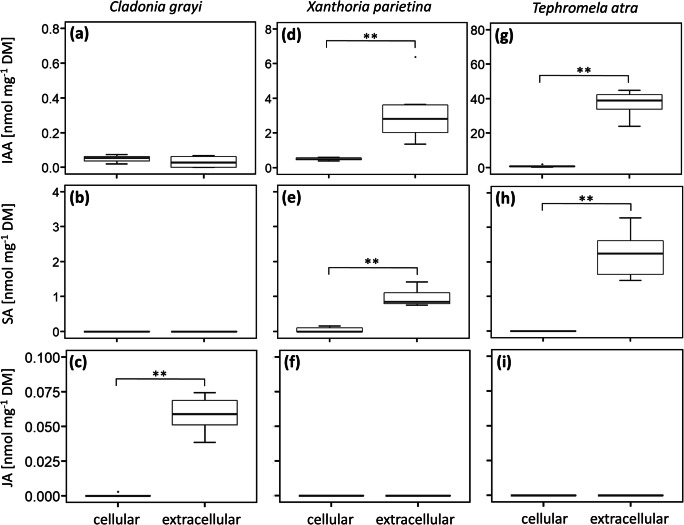
Fig. 3.
Cellular and extracellular amounts of the phytohormones indole-3-acetic acid (IAA), salicylic acid (SA) and jasmonic acid (JA) in (a-c) Cladonia grayi, (d-f) Xanthoria parietina and (g-i) Tephromela atra cultured for 7 weeks (details in Fig. 1); DM, dry mass. Box-plots show median, 25th and 75th percentiles, maxima, minima and outliers (dots), n = 6 biological replicates. Statistically significant differences according to a two-sided Mann-Whitney U test (p value <0.01) are marked with asterisks (**)

