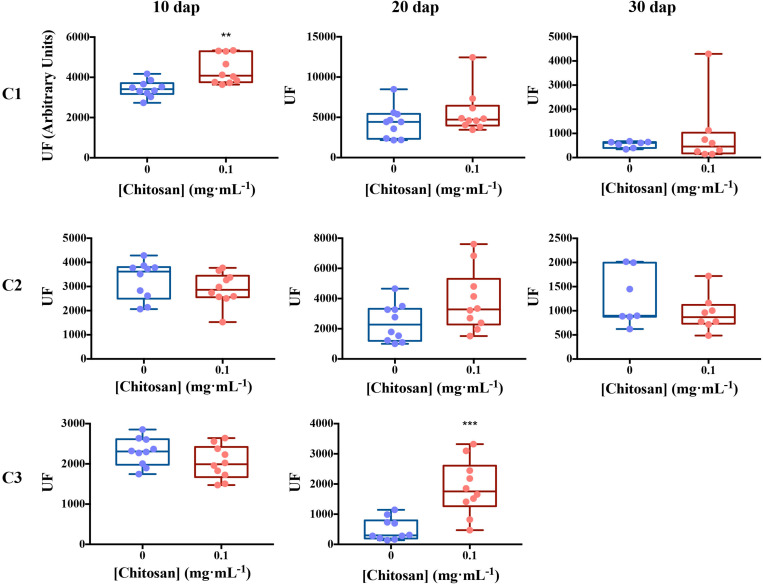
FIGURE 4.
Excitation emission matrix fluorescence dynamics of tomato root exudates. For Ex/Em coordinates of Components see Table 1. Ten biological replicates per treatment were used. EEM, emission excitation matrix; dap, days after planting; C1, component 1; C2, component 2; C3, component 3; UF, fluorescence units. Mann–Whitney test was used for not normal distribution treatments. Welch’s parametric test was used for the remaining treatments [p-values 0.05 (*), 0.01 (**), 0.001 (***), and 0.0001 (****)].

