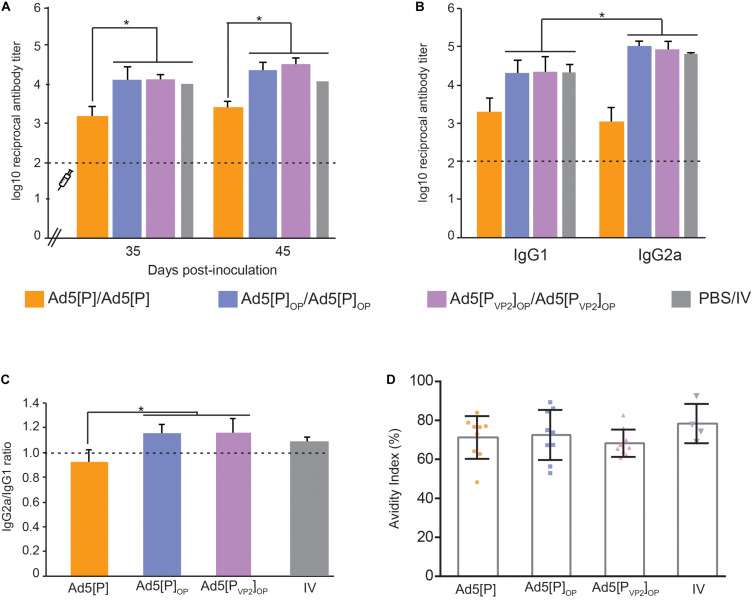
FIGURE 6.
Immune responses in mice after the administration of Ad5[P]OP and Ad5[PVP2]OP particles. (A) Kinetics of foot-and-mouth disease (FMD) antigen-specific antibodies in BALB/cJ mice. The syringe indicates the booster inoculation (at 28 dpi). Asterisks indicate statistical significance in antibody titers (p < 0.05). FMD virus (FMDV)-specific antibody titers were determined by enzyme-linked immunosorbent assay (ELISA) in sera from animals bled at 35 and 45 days post-inoculation. (B) Isotype antibody profile induced by different Ad5 candidates. ELISA titers of anti-FMDV-specific IgG1 or IgG2a determined at 45 dpi are shown. Asterisk indicates the statistically significant difference between the IgG1 and IgG2a levels (p < 0.05). (C) IgG2a/IgG1 ratio measured in each experimental group. The consistency of the IgG ratios was assessed through the determination of the significant differences in the titers of both isotypes in each group (shown at the top of the bars). (D) Avidity of the antibodies induced by different immunogens. Serum samples from inoculated mice at 45 dpi were used to estimate the avidity index as a percentage. The average index corresponded to the optical density (OD) 405 nm of the urea-treated samples divided by the OD 405 nm of those PBS-treated. Dots correspond to values from individual animals of the indicated group; the mean value is indicated (solid line).

