Figure 1.
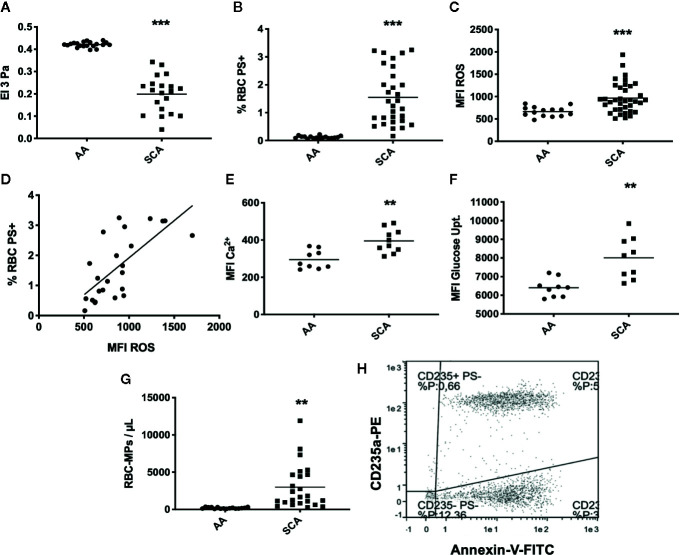
RBC deformability, eryptosis markers, and RBC-MPs in SCA and healthy (AA) individuals. (A) RBC deformability in SCA (n = 35) and AA (n = 20) subjects. (B) RBC PS exposure in SCA (n = 30) and AA (n = 20) subjects. (C) ROS content in SCA (n = 31) and AA (n = 20) subjects. (D) Correlation between PS exposure and ROS level in SCA (correlation was made in 23 patients who had both RBC-PS exposure and RBC ROS measurements, using Pearson correlation). (E) RBC Ca2+ level in SCA (n = 10) and AA (n = 9) subjects. (F) Glucose uptake in SCA (n = 9) and AA (n = 9) subjects. (G) RBC-MP plasma concentrations in SCA (n = 24) and AA (n = 16) subjects. (H) Representative flow-cytometric dot-plot used to quantify RBC-MPs in SCA patient. RBC-MPs were determined as events smaller than 0.9 µm and both positive for annexin-V and CD235a. Significant difference between AA and SCA. **p < 0.01, ***p < 0.001. Statistical comparisons between AA and SCA for RBC deformability, PS exposure, ROS content and MPs concentration were achieved using Student T-test. Statistical comparisons between AA and SCA for Ca2+ level and glucose uptake content were achieved using Mann Whitney test. MFI, mean fluorescence intensity; %RBC PS+, percentage of RBCs positive for Annexin-V; ROS, level of reactive oxygen species in RBCs detected with DCFDA; Ca2+, level of calcium in RBCs detected with Fluo3.

