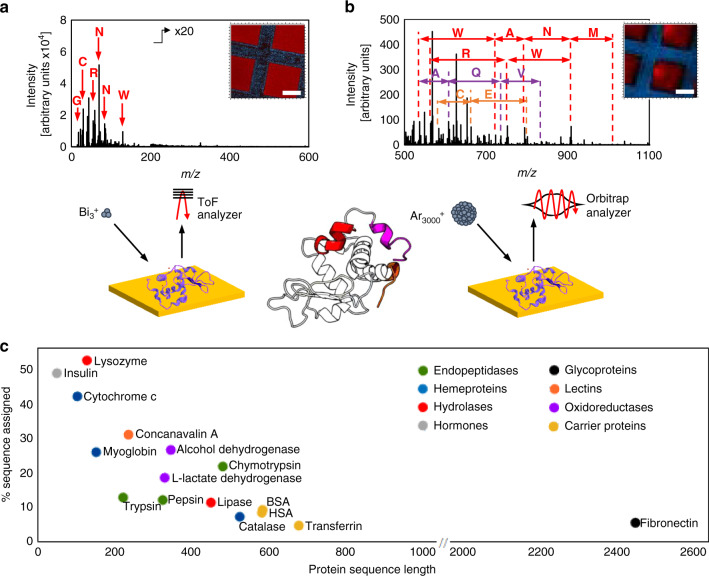
Fig. 1. Comparison of Bi3+ primary ion beam ToF-SIMS and Ar3000+ primary ion beam 3D OrbiSIMS analysis of lysozyme.
a In the positive ion secondary mass spectrum obtained using ToF-SIMS, only single amino acid fragments can be identified. b In the GCIB 3D OrbiSIMS data, protein fragments larger than single amino acids are generated due to the GCIB bombardment. Amino acid neutral losses, W-tryptophan, A-alanine, N-asparagine, M-methionine, R-arginine, Q-glutamine, T-tyrosine and V-valine can be assigned due to the high mass-resolving power and mass accuracy of the OrbitrapTM analyser. The amino acid sequences are highlighted in the lysozyme structure, exported from PDB entry1AZF38. In the associated LMIG ToF-SIMS and GCIB 3D OrbiSIMS images of lysozyme film under a gold grid, blue represents the gold signal and red represents a sum of (a) amino acid fragments listed in Supplementary Table 1 and (b) assigned peptide fragments listed in Supplementary Fig. 6. The scale bars represent 50 μm. c Sixteen proteins of different biological functions were analysed. From 5% (transferrin) to 53% (lysozyme) sequence coverage was achieved for a range of sizes from 51 to 2446 amino acids.

