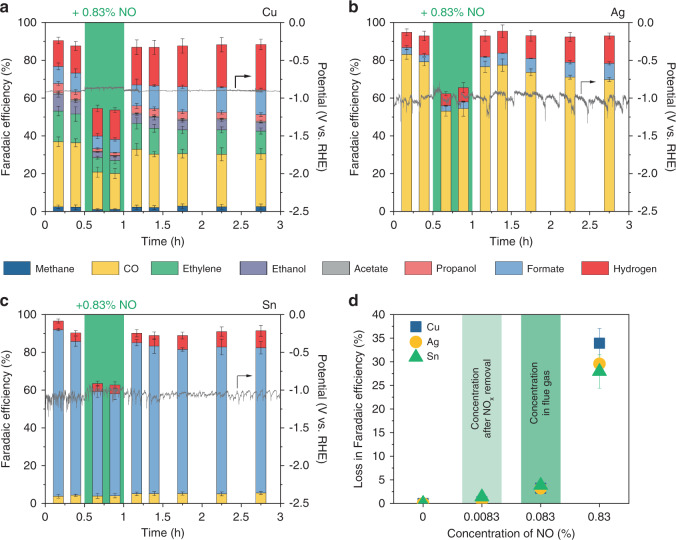
Fig. 2. CO2 electroreduction performance in the presence of NO.
Faradaic efficiency and applied potential vs. time on (a) Cu, (b) Ag, and (c) Sn catalysts at a constant current density of 100 mA cm−2 in 1 M KHCO3 for 3 h. Gas feeds were 83.3% CO2 and 16.7% Ar, and 83.3% CO2, 15.87% Ar, and 0.83% NO (green). 0.83% NO was introduced at 0.5 h for 0.5 h. Corresponding Faradaic efficiencies are provided in Supplementary Tables 2–4. (d) Effect of different concentrations of NO in CO2 electroreduction on Cu, Ag, and Sn catalysts. 0.083% and 0.0083% represent the typical NOx concentrations in flue gases and flue gases after NOx removal processes, respectively. Corresponding Faradaic efficiencies are provided in Supplementary Table 6. Error bars represent the standard deviation of three independent measurements.

