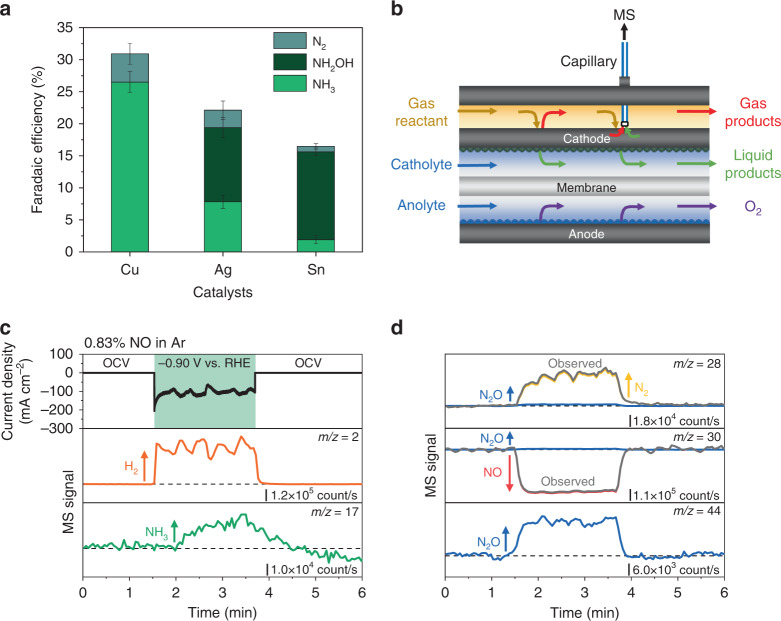
Fig. 4. Investigation of the NO electroreduction products.
(a) Faradaic efficiency of NO electroreduction products produced during electrolysis with 83.3% CO2, 15.87% Ar, and 0.83% NO on Cu, Ag, and Sn catalysts at a constant current density of 100 mA cm−2 in 1 M KHCO3 for 3 h. Corresponding Faradaic efficiencies are provided in Supplementary Table 14. Error bars represent the standard deviation of three independent measurements. (b) Schematic of flow electrochemical mass spectrometry (FEMS) setup. (c) Measured current density vs. time, and deconvoluted MS signal vs. time for m/z = 2, m/z = 17, (d) m/z = 28, m/z = 30, and m/z = 44 from FEMS on Cu catalyst in 1 M KHCO3 with 0.83% NO in Ar. −0.90 V vs. RHE was applied for approximately 2 min starting at t = 1.5 min. NORR products have been deconvoluted using the mass spectra of individual products shown in Supplementary Fig. 17. Additional information is provided in the Methods section and Supplementary Figs. 18 and 19.

